Table Of Contents
Introduction
Thanos is an open source, highly available Prometheus setup with long term storage and querying capabilities.
Let’s look at how we can set it up for multi-cluster monitoring in AWS.
Architecture
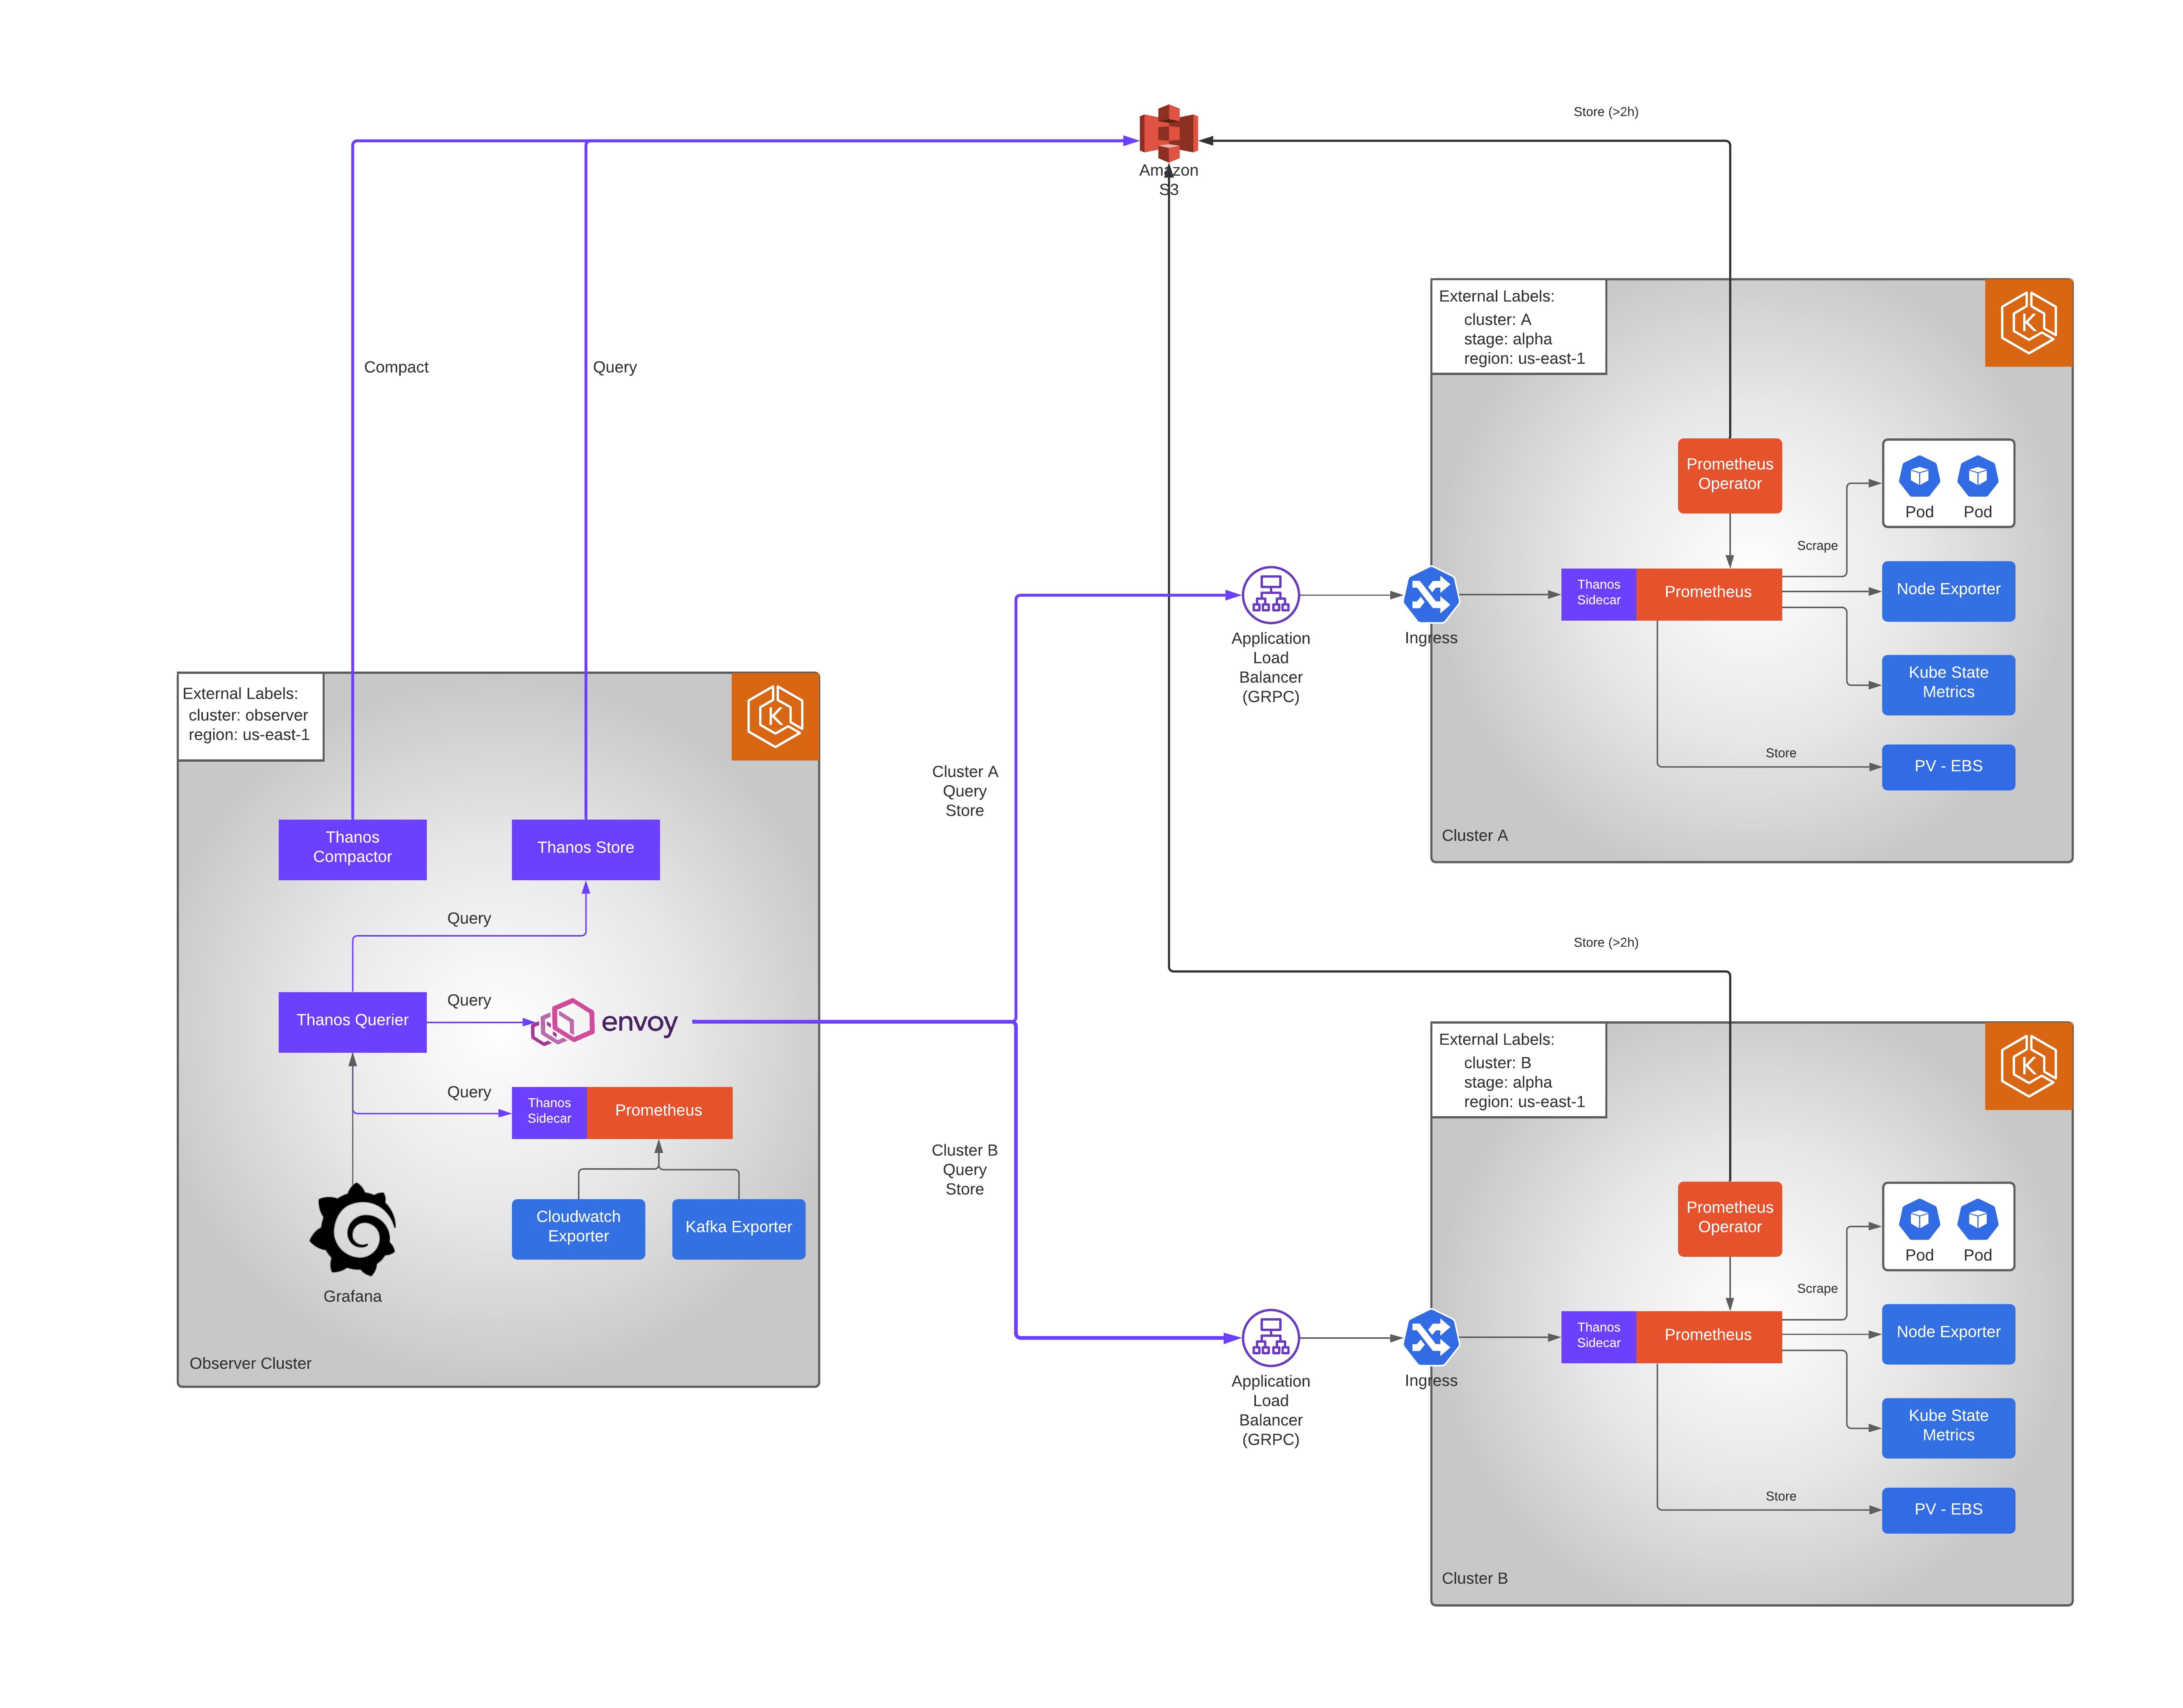
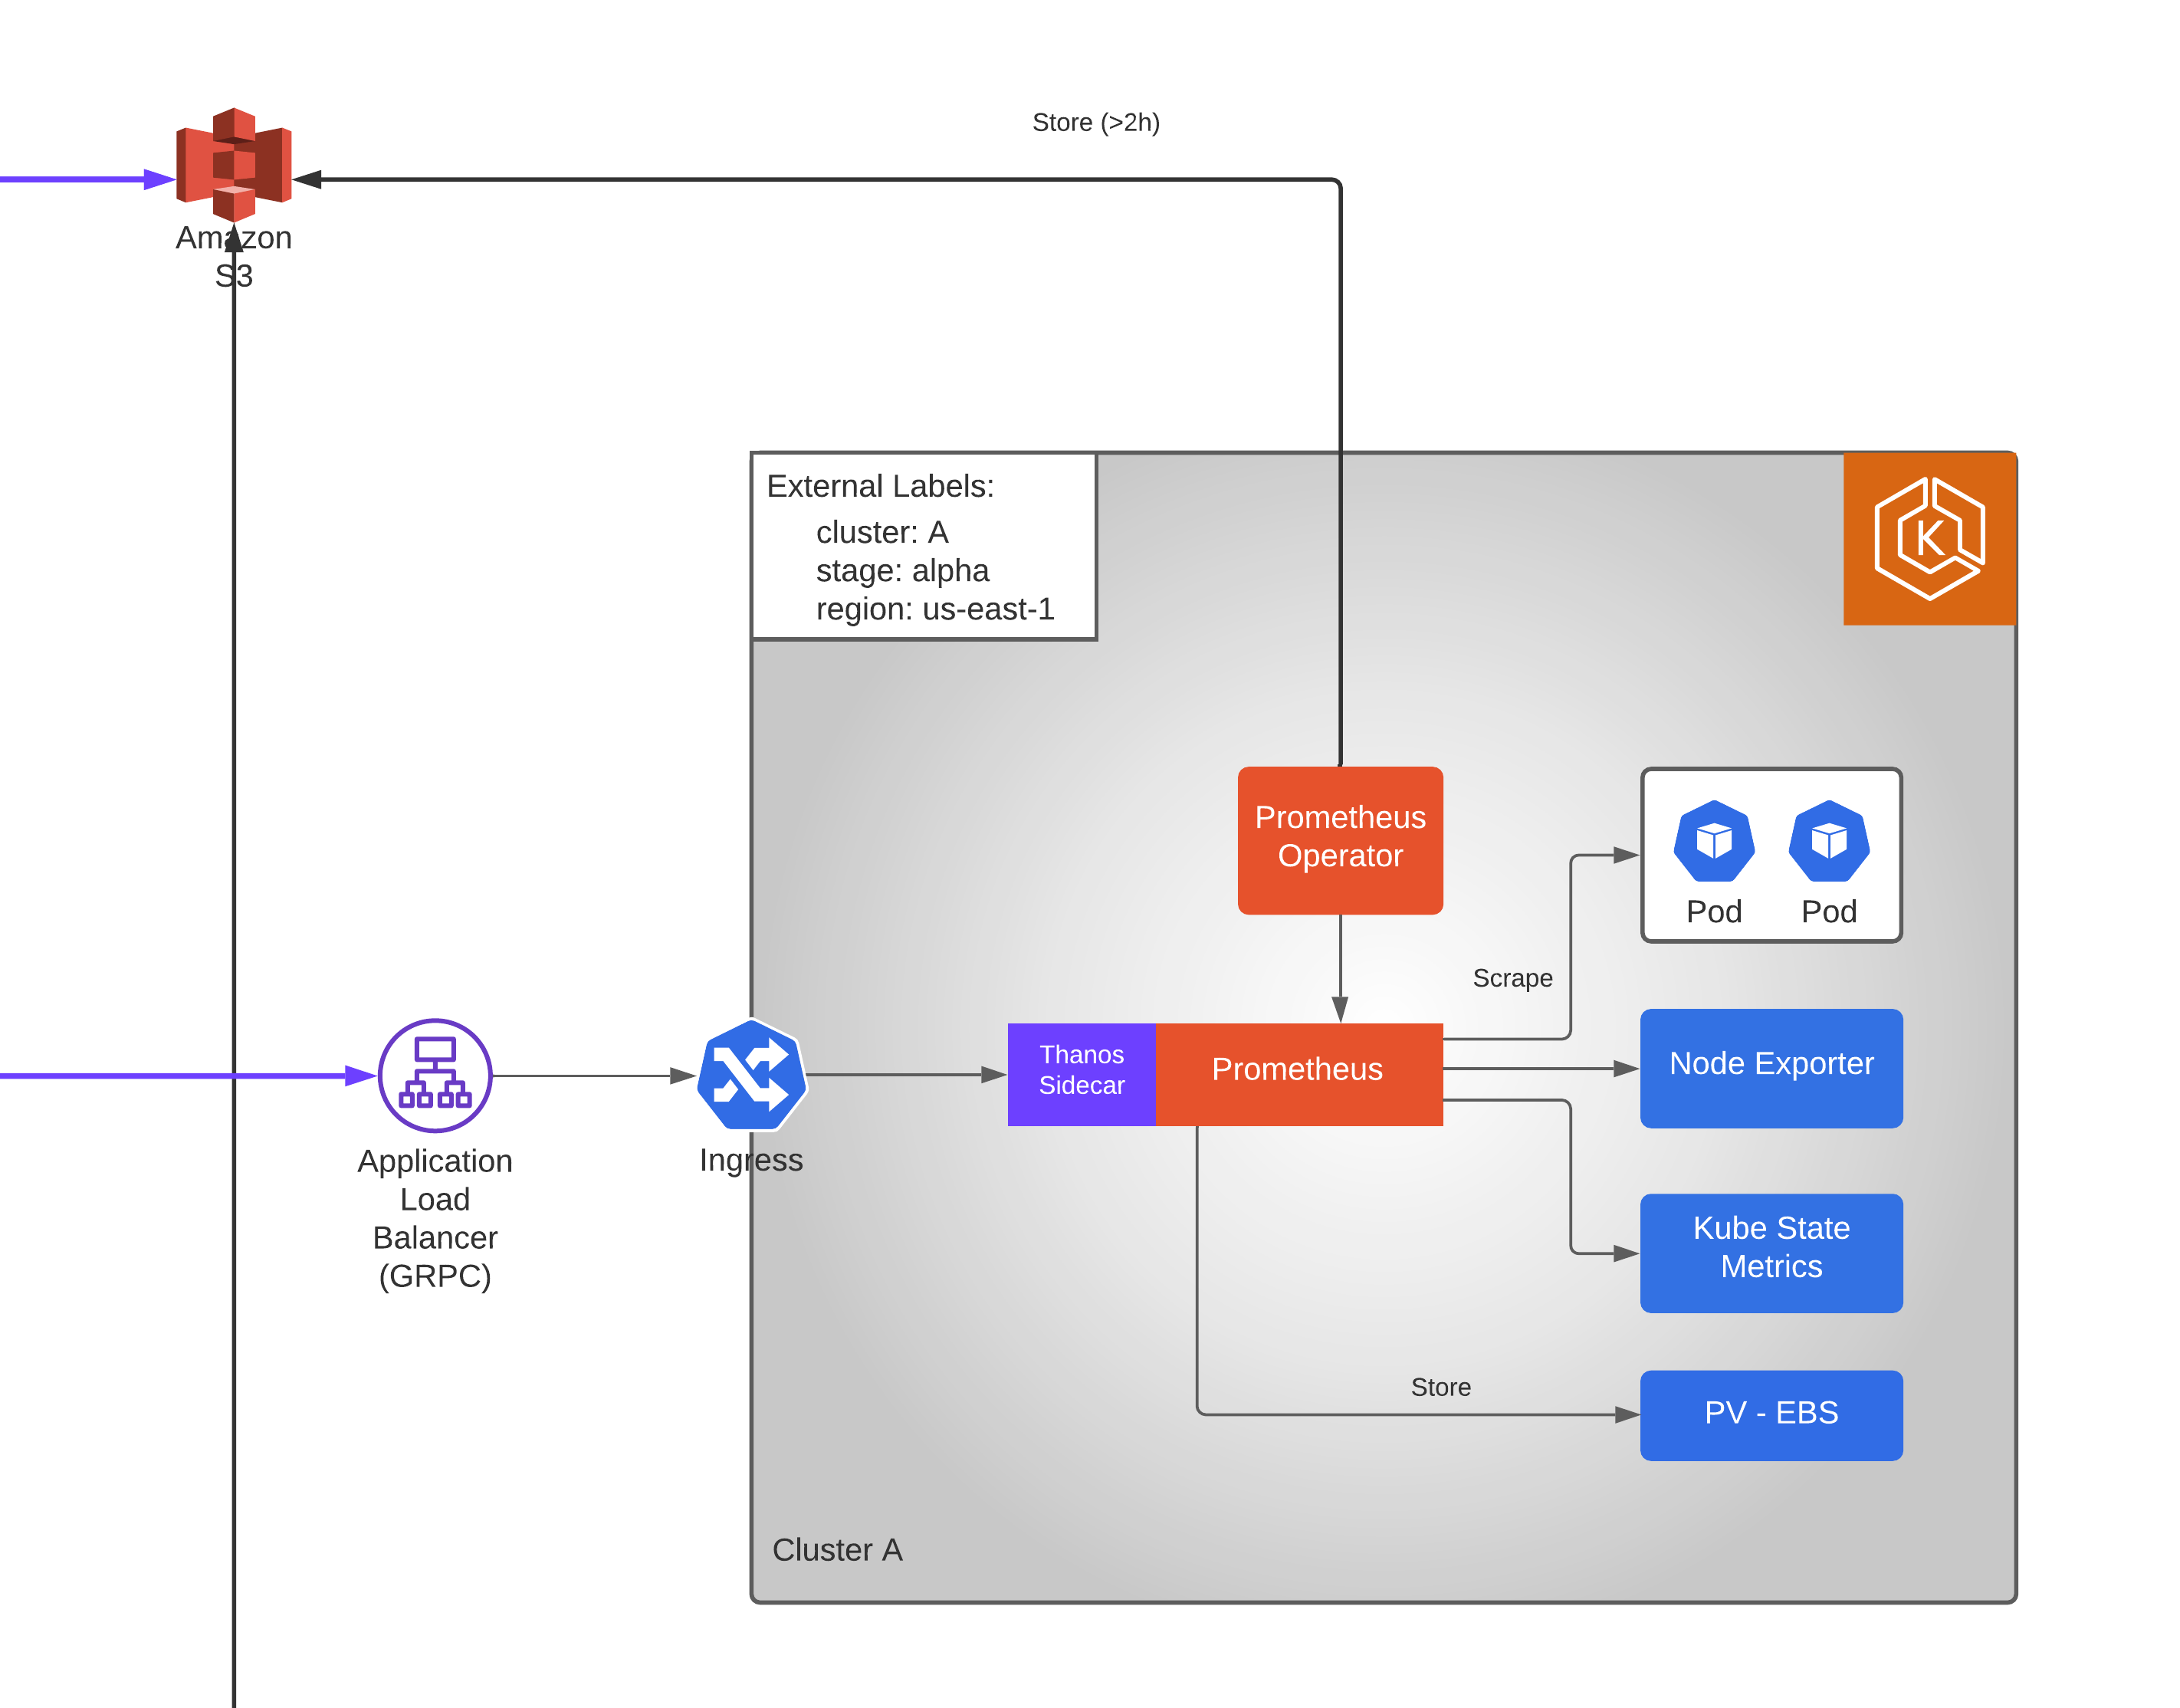
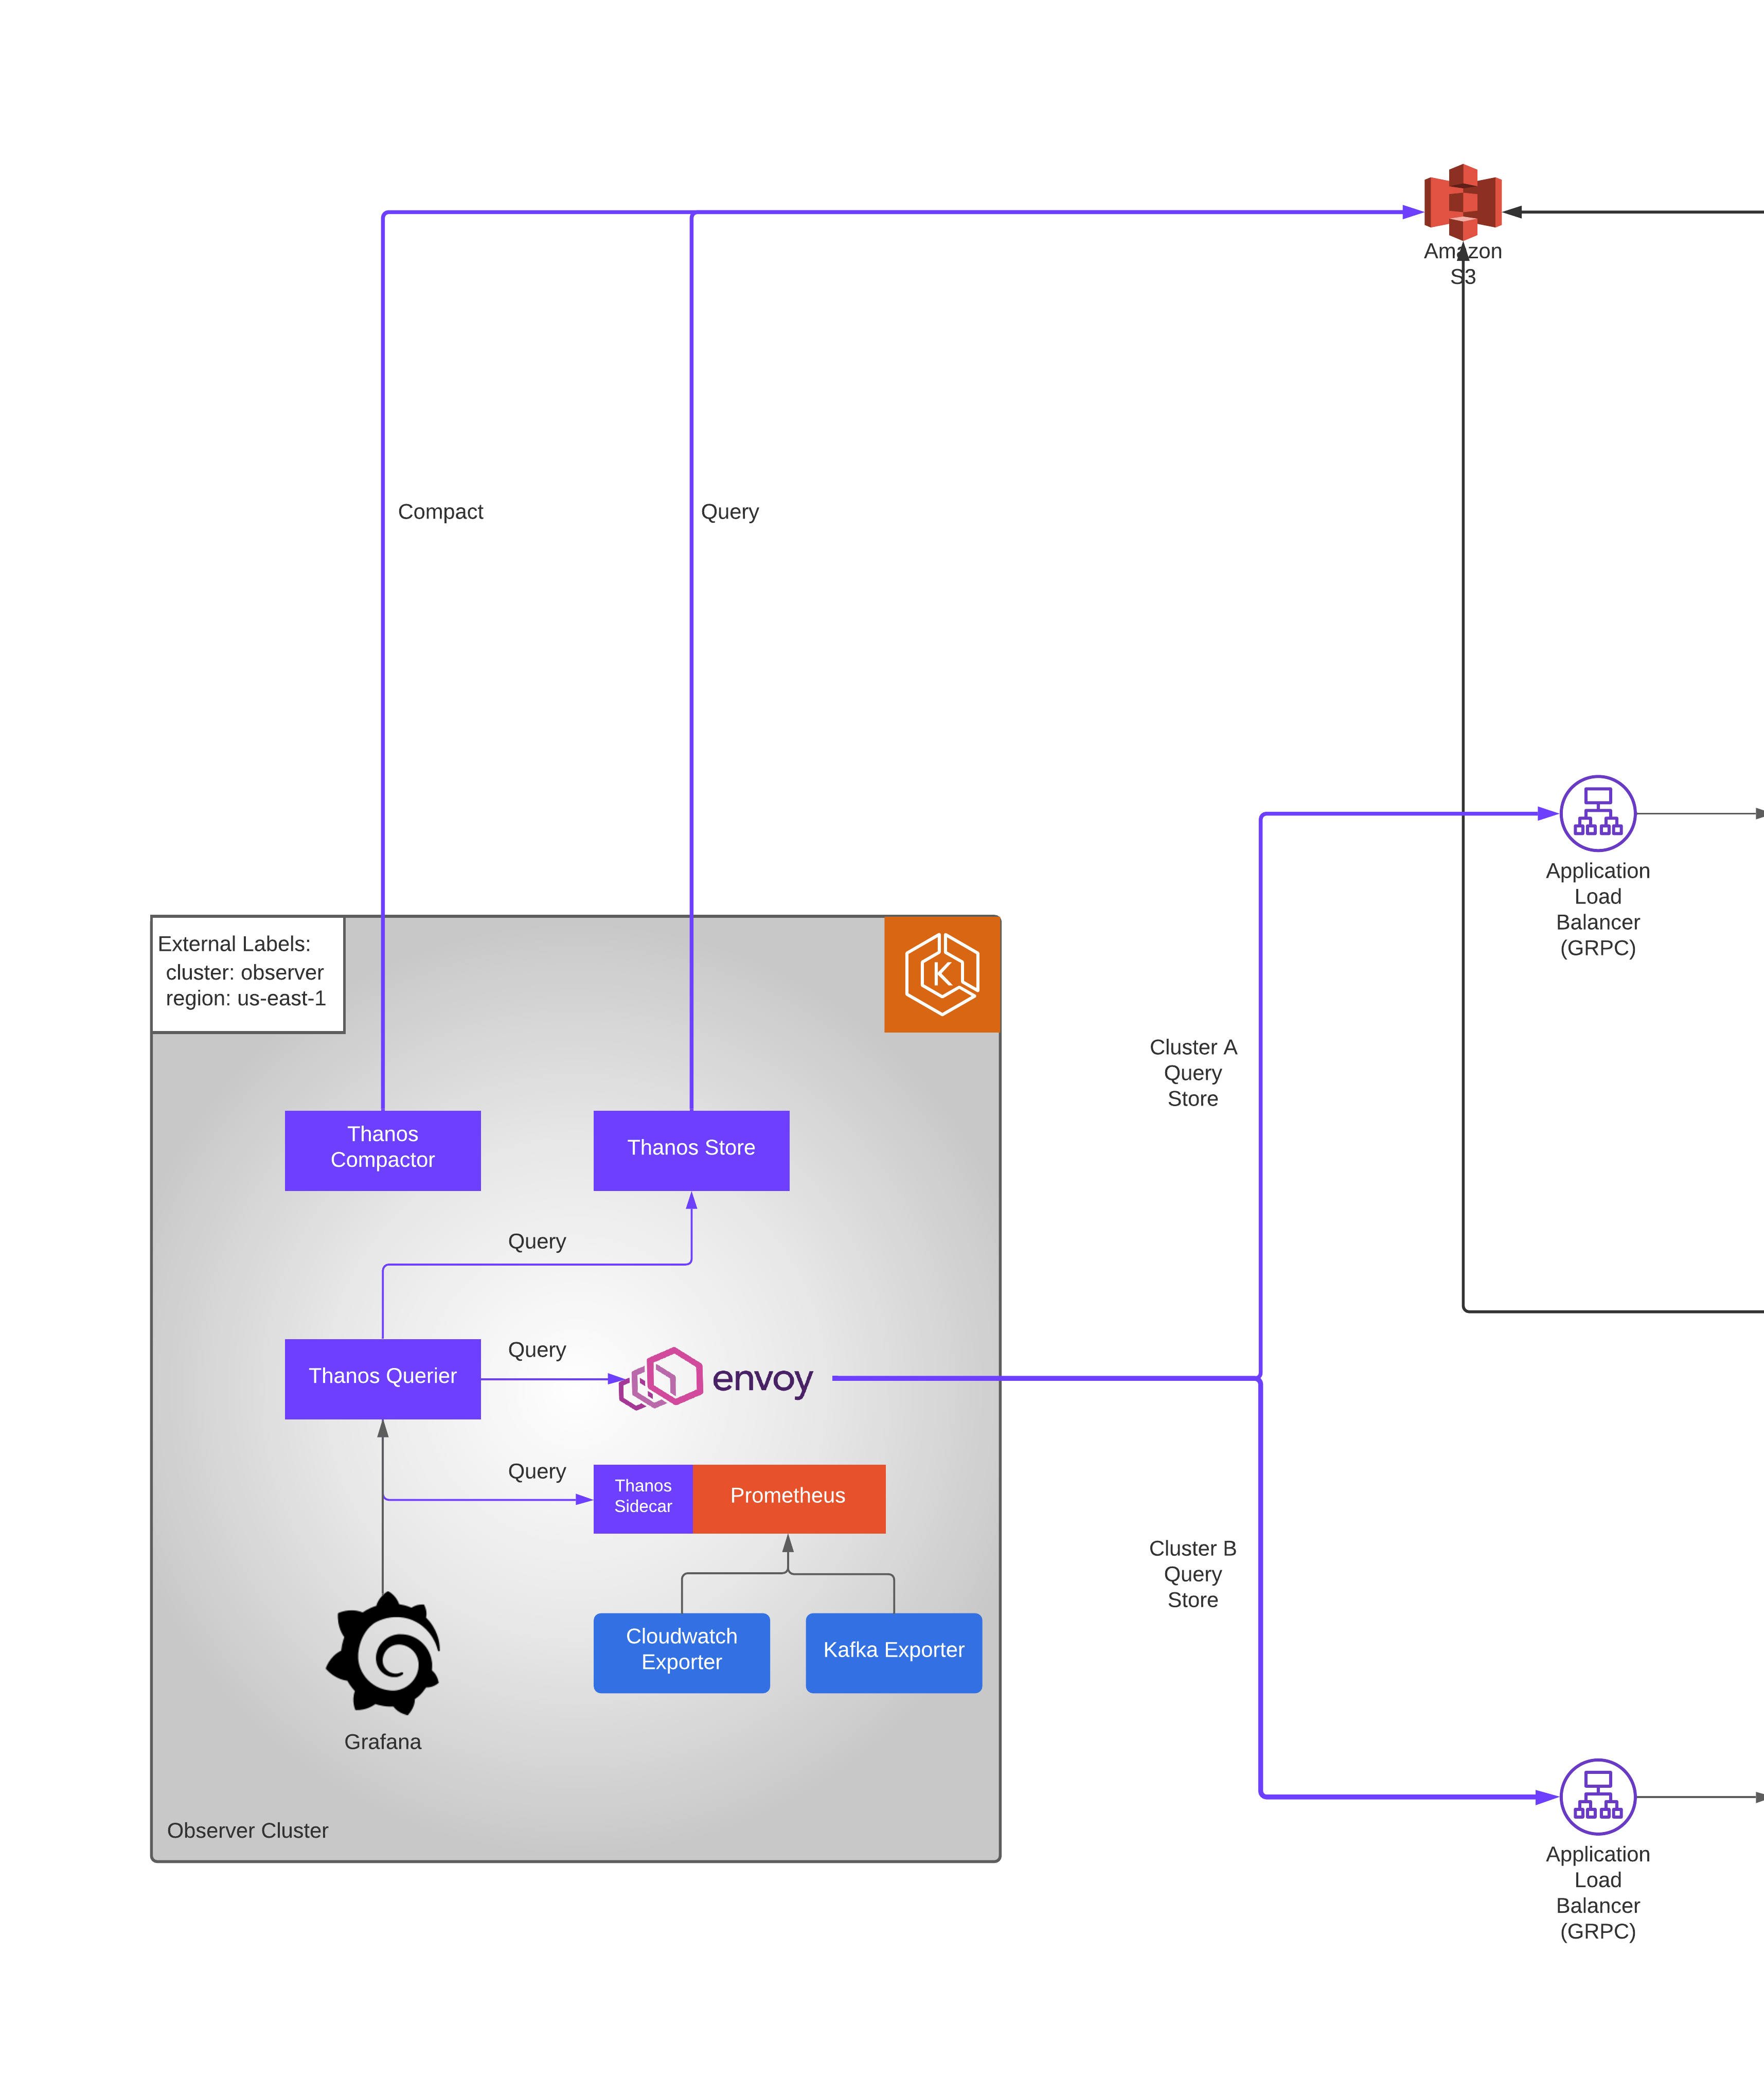
Consider we have multiple kubernetes clusters (e.g. Cluster A, Cluster B etc.) that we would like to monitor (node, pod metrics etc.) from a central Observer cluster.
Below is a reference architecture in AWS showcasing how we could achieve it with Thanos:
Repositories

Kube Prometheus Stack
Kube Prometheus is an open source project that provides easy to operate end-to-end Kubernetes cluster monitoring with Prometheus using the Prometheus Operator.
It packages below components:
- Prometheus Operator
- Highly available Prometheus
- Prometheus Node Exporter
- Kube State Metrics
as well other components such as grafana, alert manager etc.
For our setup, we will install Kube Prometheus Stack in each our clusters that we would like to monitor.
Since we are planning for monitoring from a central observer cluster, we do not want to install some tools e.g. grafana in each of the clusters.
We make use of the helm chart repo [https://github.com/HarshadRanganathan/helm-aws-prometheus-stack] and override the values for easy installation.
Let’s see what’s involved in setting up below components in a single cluster:
Clone the open source repo and create a new shared-values.yaml.
[1] We would want to give the stack a shorter name so let’s override few helm variables in the chart to achieve that.
shared-values.yaml
nameOverride: prometheus
fullnameOverride: prometheus
[2] Let’s disable components that we don’t want to be installed in our cluster.
shared-values.yaml
grafana:
  enabled: false

# disable prometheus service monitors for below components
kubelet:
  enabled: false
kubeControllerManager:
  enabled: false
coreDns:
  enabled: false
kubeApiServer:
  enabled: false
kubeEtcd:
  enabled: false
kubeScheduler:
  enabled: false
kubeProxy:
  enabled: false
[3] We need node exporter and kube-state-metrics to be installed as they provide metrics related to the node, deployment, pods etc.
shared-values.yaml
kubeStateMetrics:
  enabled: true
nodeExporter:
  enabled: true
Prometheus Operator
[4] Now it’s time to configure the Prometheus Operator.
The Prometheus Operator provides Kubernetes native deployment and management of Prometheus and related monitoring components.
shared-values.yaml
prometheusOperator:
  kubeletService:
    enabled: false
  resources:
    requests:
      cpu: 500m
      memory: 100Mi
    limits:
      cpu: 700m
      memory: 200Mi
Here, we define the resource limits for the prometheus operator instance.
Prometheus
[5] Continuing further, we define the prometheus settings.
shared-values.yaml
prometheus:
  serviceAccount:
    create: false
    name: prometheus
  prometheusSpec:
    scrapeInterval: "1m"
    scrapeTimeout: "60s"
    evaluationInterval: "1m"
    retention: 7d
    resources:
      requests:
        cpu: 200m
        memory: 1000Mi
      limits:
        cpu: 2500m
        memory: 20000Mi
    storageSpec:
      volumeClaimTemplate:
        metadata:
          name: prometheus
        spec:
          storageClassName: gp2
          accessModes: ["ReadWriteOnce"]
          resources:
            requests:
              storage: 30Gi
Here, we had defined couple of things. Let’s go one-by-one.
First, we instruct the prometheus instance to use a service account named prometheus. This service account will be linked to an IAM role which has permissions to write the metric data to S3.
Secondly, we define the scrape settings and retention period. Define these based on your needs (avoid setting these to low values unless needed).
    scrapeInterval: "1m"
    scrapeTimeout: "60s"
    evaluationInterval: "1m"
    retention: 7d
Next, we define the resource requests. Prometheus instance consumes lot of CPU and memory depending on how much metric it scrapes.
So, make sure to fine tune these based on usage.
    resources:
      requests:
        cpu: 200m
        memory: 1000Mi
      limits:
        cpu: 2500m
        memory: 20000Mi
Finally, we define a Persistent Volume which in AWS is backed by EBS to store the metrics data.
Prometheus instance will scrape metrics from the sources defined such as pods, node exporter etc and will store them in EBS for the retention period defined. So, make sure to give adequate storage for it.
    storageSpec:
      volumeClaimTemplate:
        metadata:
          name: prometheus
        spec:
          storageClassName: gp2
          accessModes: ["ReadWriteOnce"]
          resources:
            requests:
              storage: 30Gi
Here, we request for 30 Gb storage from our persistent volume.
Thanos Sidecar
Thanos Sidecar is a component which performs following actions:
- Serves as a sidecar container alongside Prometheus
- Uploads Prometheus chunks to an object storage
- Serves as an entry point for PromQL queries
Let’s configure the thanos sidecar.
shared-values.yaml
    thanos:
      baseImage: quay.io/thanos/thanos
      version: v0.18.0
      objectStorageConfig:
        name: thanos-objstore-config
        key: thanos.yaml
Here, we define the baseImage and version of thanos that we would like to use.
Also, we specify to use a secret named thanos-objstore-config with key as thanos.yml which will contain the object store configuration details.
Let’s create a new file named thanos-config.yaml which will contain our object store configuration details.
thanos-config.yaml
type: s3
config:
  bucket: prod-metrics-storage
  endpoint: s3.us-east-1.amazonaws.com
  sse_config:
    type: "SSE-S3"
Here, we have defined that our object store is S3, the bucket to be used is named prod-metrics-storage and that it uses SSE-S3 encryption.
You then create the secret so that when you install the kube-prometheus-chart the thanos sidecar will get the object configuration details from this secret.
kubectl -n platform create secret generic thanos-objstore-config --from-file=thanos.yaml=thanos-config.yaml
Ingress
Finally, it’s time to expose our thanos sidecar so that it can be accessed from the observer cluster for running queries.
For this purpose, we make use of an ALB with gRPC support since thanos communicates using gRPC protocol.
To have this set up running, you need to have an ALB controller and External DNS in your kubernetes cluster. Steps to configure them is beyond the scope of this article.
Once you have the dependent software components in your cluster you can add some annotations which will be used to configure the ALB and Route53 records so that the observer cluster can communicate with the thanos sidecar in a different cluster which is the basis for multi-cluster monitoring.
To configure an ALB ingress with DNS, add below in your shared-values.yaml since they won’t change for each cluster:
  service:
    type: NodePort
  thanosIngress:
    enabled: true
    paths:
    - /*
    annotations:
      external-dns/zone: private
      kubernetes.io/ingress.class: alb
      alb.ingress.kubernetes.io/scheme: internal
      alb.ingress.kubernetes.io/backend-protocol-version: GRPC
      alb.ingress.kubernetes.io/listen-ports: '[{"HTTPS":443}]'
      alb.ingress.kubernetes.io/ssl-policy: ELBSecurityPolicy-TLS-1-2-Ext-2018-06
Let’s see what we have defined here.
We instruct kubernetes that the service is of type NodePort.
We then define the ingress to allow all traffic matching path / (Note: ALB needs the path to be suffixed with wildcard /*) to be routed to the service.
Since, we need the DNS to be resolvable only within AWS, we define the external-dns/zone as private.
To provision a gRPC based ALB, you define these annotations:
      kubernetes.io/ingress.class: alb
      alb.ingress.kubernetes.io/scheme: internal
      alb.ingress.kubernetes.io/backend-protocol-version: GRPC
      alb.ingress.kubernetes.io/listen-ports: '[{"HTTPS":443}]'
      alb.ingress.kubernetes.io/ssl-policy: ELBSecurityPolicy-TLS-1-2-Ext-2018-06
which specifies the below:
- ALB ingress class to be used
- Internal load balancer to be provisioned
- ALB protocol is gRPC
- Listening port is HTTPS
- SSL policy version to be used
For each cluster environment, your dns name and HTTPS certificate is going to vary.
For that purpose, create an env/cluster specific file e.g. cluster-a-prod-values.yaml to provide cluster/env specific values.
prometheus:
  thanosIngress:
    hosts:
    - clusterA.prometheus.example.net
    annotations:
      external-dns.alpha.kubernetes.io/hostname: clusterA.prometheus.example.net
      alb.ingress.kubernetes.io/certificate-arn: arn:aws:acm:us-east-1::certificate/<arn>
      alb.ingress.kubernetes.io/load-balancer-attributes: access_logs.s3.enabled=true,access_logs.s3.bucket=,access_logs.s3.prefix=awselasticloadbalancing/clusterA
Here, you define the hostname for your ALB using annotation external-dns.alpha.kubernetes.io/hostname which your External DNS will configure in private hosted zone of Route53.
Your ALB ACM certificate ARN and access log locations using respective annotations.
Also, you restrict your Ingress to accept traffic only from the specified hostname.
External Labels
Now we have prometheus, thanos, ALB configured, how do we distinguish that our metrics are coming from clusterA?
For this purpose, prometheus provides External labels which can used to define labels that you want to be exported as part of each metric.
Without external labels, your cluster metric could be like this:
node_cpu_seconds{container="node-exporter",cpu="0",endpoint="metrics"
,job="node-exporter",namespace="platform",pod="prometheus-prometheus-node-exporter-z6ncr,
prometheus_replica="prometheus-prometheus-prometheus-0",service="prometheus-prometheus-node-exporter"}
Within the cluster this makes sense, but when you want to view it from a centralized place e.g. grafana you would want to know which cluster this is part of and your dashboards to show metrics only from a specific cluster instead of metrics from all clusters.
Let’s define some labels that will help us in filtering the metrics later.
cluster-a-prod-values.yaml
  prometheusSpec:
    externalLabels:
      cluster: clusterA
      stage: prod
      region: us-east-1
Here, we define labels such as cluster name, environment it’s part of and the AWS region.
Once configured, the metrics exported should have these labels:
node_cpu_seconds{container="node-exporter",cpu="0",endpoint="metrics",
job="node-exporter",namespace="platform",pod="prometheus-prometheus-node-exporter-z6ncr,
prometheus_replica="prometheus-prometheus-prometheus-0",service="prometheus-prometheus-node-exporter",
cluster="clusterA",region="us-east-1",stage="prod"}
Installation
Now it’s time to install our chart.
helm upgrade -i prometheus . -n platform --values=shared-values.yaml --values=cluster-a-prod-values.yaml
This will install the helm chart in the cluster which performs the following actions:
[1] Install the prometheus operator
[2] Configure the prometheus and thanos configuration details in configmap/secrets
[3] Prometheus operator will start up a new prometheus instance with thanos sidecar along with node exporter and kube state metrics
[4] Configure service and Ingress objects
[5] ALB controller will spin up a new gRPC based ALB
[6] External DNS will configure the Route53 record in private hosted zone for DNS resolution
Post which prometheus will start scraping the metrics from all pods, objects for which service monitors are configured for scrapping e.g. node exporter.
Storage:
[1] Prometheus will store the metrics in the EBS backed volume
[2] Thanos sidecar will export the metrics to S3 bucket for every 2 hours
[3] Metrics in EBS will remain until the configured retention period
Query:
[1] You can now send queries to the cluster via the ALB to the Thanos sidecar which will respond with the metrics available in the local node realtime.
Observer Cluster
Now, we will focus on the setups to be done in the Observer cluster.
As per our design, we need to access the prometheus metrics from the centralized observer cluster across all the clusters that we need to monitor.
Kube Prometheus Stack
Similar to how we set up the kube-prometheus-stack in the other clusters, we need to also set it up in the Observer cluster for two purposes:
[1] We need to monitor the health of the Observer cluster
[2] We need to monitor the components installed in the Observer cluster e.g. exporters
We will use the same helm chart repo [https://github.com/HarshadRanganathan/helm-aws-prometheus-stack] and override the values for easy installation.
Let’s add a new env/cluster specific file e.g. observer-prod-values.yaml with required settings.
prometheus:
  thanosIngress:
    enabled: false
  prometheusSpec:
    externalLabels:
      cluster: observer
      stage: prod
      region: us-east-1
Here, we just disable the thanos ingress as we don’t need to have it exposed.
Other settings come from the default values.yaml and shared-values.yaml file in our repository.
Install the chart and you will have prometheus running in the cluster.
helm upgrade -i prometheus . -n platform --values=shared-values.yaml --values=observer-prod-values.yaml
Envoy Proxy
Next, we need envoy proxy to be able to connect with the other clusters.
Reason why we need it is that the certificate validation fails against ALB with error transport: authentication handshake failed: x509: cannot validate certificate for xxx because it doesn't contain any IP SANs.
Thanos underneath uses golang with gRPC protocol which fails if the certificate has missing fields.
So, we use envoy proxy as a middleware as it doesn’t perform these checks.
Let’s see the complete envoy configuration and we will break it down into sections for better understanding.
files:
  envoy.yaml: |-
    admin:
      access_log_path: /dev/null
      address:
        socket_address:
          address: 0.0.0.0
          port_value: 9901
    static_resources:
      listeners:
      - name: listener_clusterA
        address:
          socket_address:
            address: 0.0.0.0
            port_value: 10000
        filter_chains:
        - filters:
          - name: envoy.filters.network.http_connection_manager
            typed_config:
              "@type": type.googleapis.com/envoy.extensions.filters.network.http_connection_manager.v3.HttpConnectionManager
              stat_prefix: ingress_http
              access_log:
              - name: envoy.access_loggers.file
                typed_config:
                  "@type": type.googleapis.com/envoy.extensions.access_loggers.file.v3.FileAccessLog
                  path: /dev/stdout
                  log_format:
                    text_format: |
                      [%START_TIME%] "%REQ(:METHOD)% %REQ(X-ENVOY-ORIGINAL-PATH?:PATH)% %PROTOCOL%"
                      %RESPONSE_CODE% %RESPONSE_FLAGS% %RESPONSE_CODE_DETAILS% %BYTES_RECEIVED% %BYTES_SENT% %DURATION%
                      %RESP(X-ENVOY-UPSTREAM-SERVICE-TIME)% "%REQ(X-FORWARDED-FOR)%" "%REQ(USER-AGENT)%"
                      "%REQ(X-REQUEST-ID)%" "%REQ(:AUTHORITY)%" "%UPSTREAM_HOST%" "%UPSTREAM_TRANSPORT_FAILURE_REASON%"\n
              - name: envoy.access_loggers.file
                typed_config:
                  "@type": type.googleapis.com/envoy.extensions.access_loggers.file.v3.FileAccessLog
                  path: /dev/stdout
              http_filters:
              - name: envoy.filters.http.router
              route_config:
                name: local_route
                virtual_hosts:
                - name: local_service
                  domains: ["*"]
                  routes:
                  - match:
                      prefix: "/"
                      grpc: {}
                    route:
                      host_rewrite_literal: clusterA.prometheus.example.net
                      cluster: service_clusterA
      clusters:
      - name: service_clusterA
        connect_timeout: 30s
        type: logical_dns
        http2_protocol_options: {}
        dns_lookup_family: V4_ONLY
        load_assignment:
          cluster_name: service_clusterA
          endpoints:
          - lb_endpoints:
            - endpoint:
                address:
                  socket_address:
                    address: clusterA.prometheus.example.net
                    port_value: 443
        transport_socket:
          name: envoy.transport_sockets.tls
          typed_config:
            "@type": type.googleapis.com/envoy.extensions.transport_sockets.tls.v3.UpstreamTlsContext
            sni: clusterA.prometheus.example.net
            common_tls_context:
              alpn_protocols:
              - "h2"
Below is the flow of above configuration file:
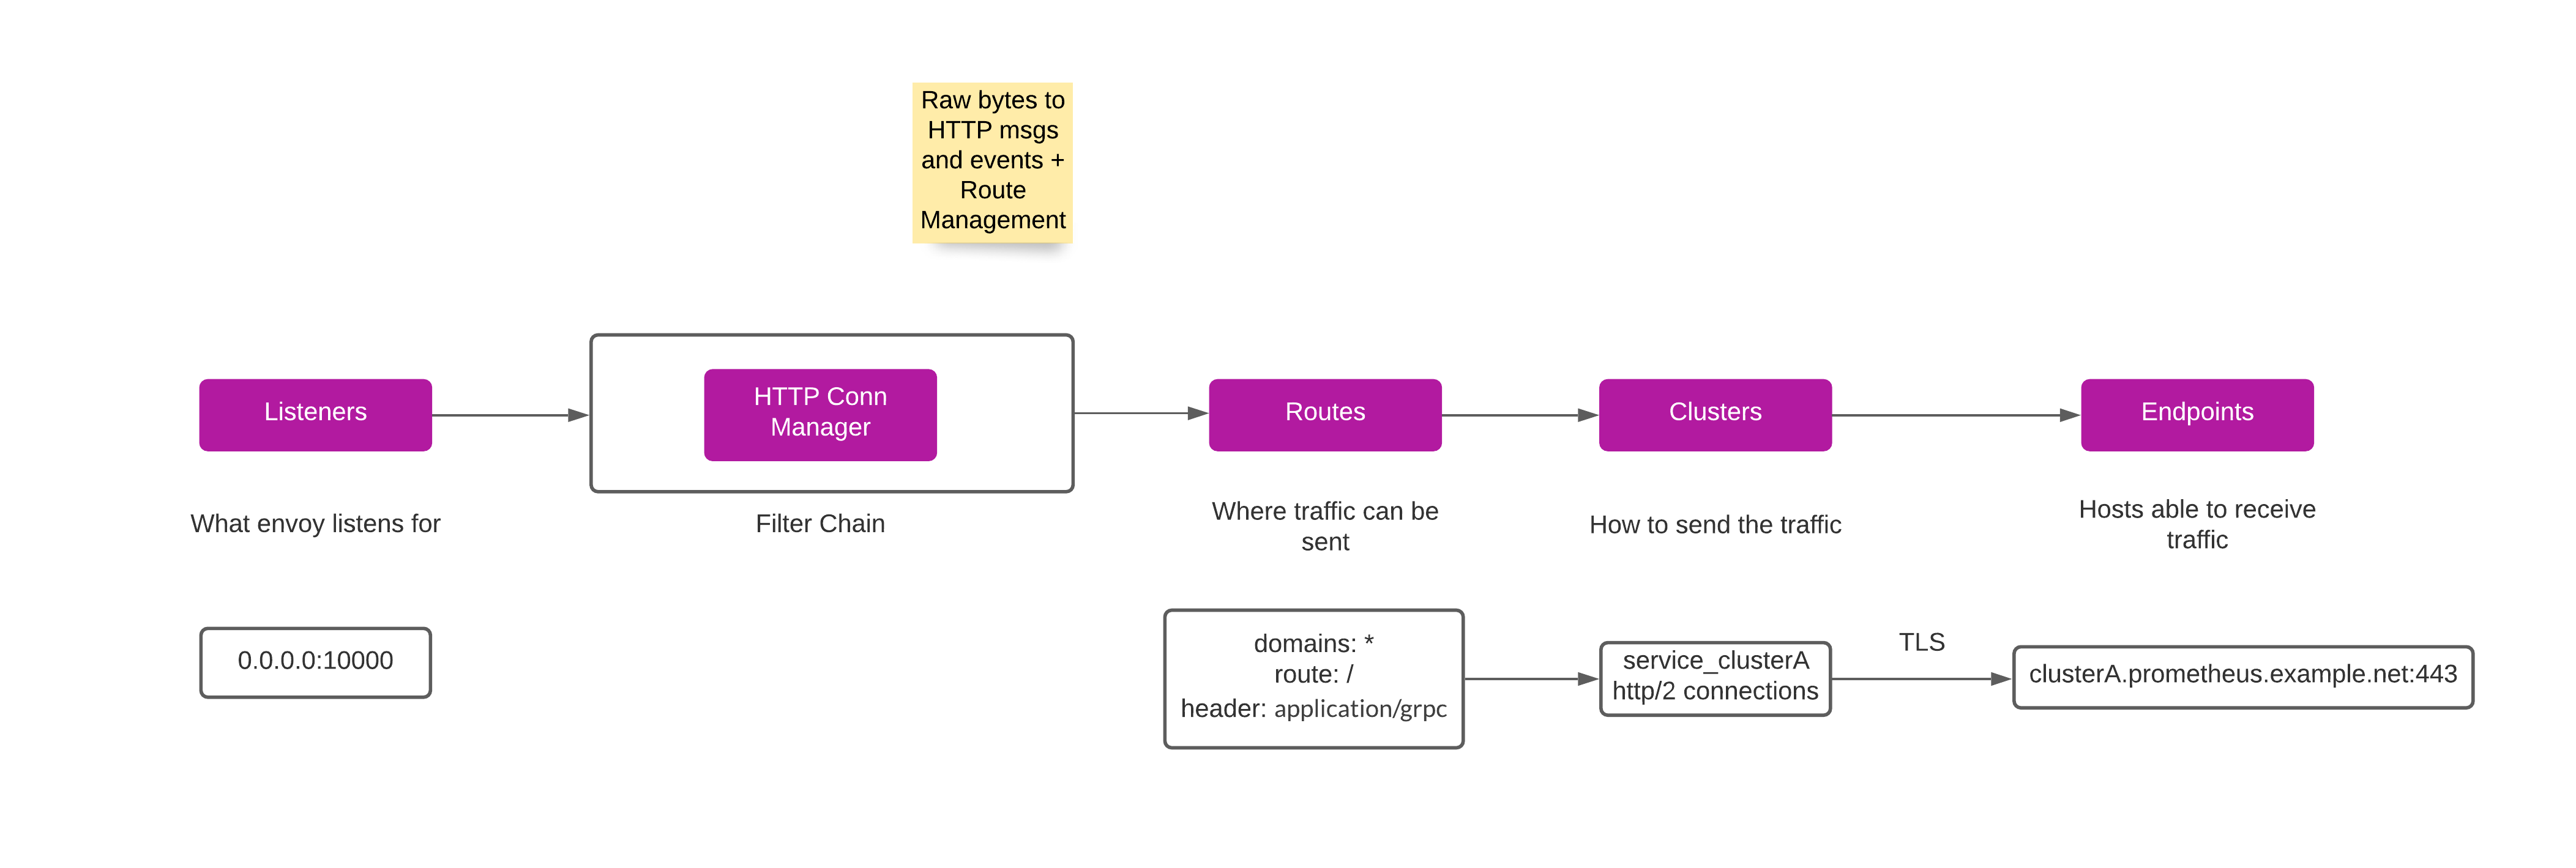
Listeners
Envoy sits in between Thanos and proxies the connection requests to various clusters having thanos sidecar.
So, for each cluster we need to proxy the request, need to have a listener running.
listeners:
  - name: listener_clusterA
    address:
      socket_address:
        address: 0.0.0.0
        port_value: 10000
In above, we configure envoy to start a listener at port 10000 for let’s say clusterA whose metrics we need to access from the observer cluster.
Filters
Each Listener then defines a set of filters that sit in the data path, collectively forming a filter chain.
By composing and arranging a set of filters, users can configure Envoy to translate protocol messages, generate statistics, perform RBAC, etc.
Envoy provides numerous built-in filters
HTTP connection management
Envoy has a built in network level filter called the HTTP connection manager.
This filter translates raw bytes into HTTP level messages and events (e.g., headers received, body data received, trailers received, etc.).
It also handles functionality common to all HTTP connections and requests such as access logging, request ID generation and tracing, request/response header manipulation, route table management, and statistics.
Initial set of configs are around Access logs, after which we do route management.
route_config:
  name: local_route
  virtual_hosts:
    - name: local_service
      domains: ["*"]
      routes:
        - match:
            prefix: "/"
            grpc: {}
          route:
            host_rewrite_literal: clusterA.prometheus.example.net
            cluster: service_clusterA
Here, we configure a virtual host that maps domains to a set of routing rules.
We create a route match to only gRPC requests since that is the protocol used by Thanos.
Also, we configure to swap the host header during forwarding with the original host name requested by the client.
Clusters
Finally, we configure the upstream clusters.
clusters:
  - name: service_clusterA
    connect_timeout: 30s
    type: logical_dns
    http2_protocol_options: {}
    dns_lookup_family: V4_ONLY
Above are some basic configurations:
[1] Service discovery type is set to logical_dns - a logical DNS cluster only uses the first IP address returned when a new connection needs to be initiated. Thus, a single logical connection pool may contain physical connections to a variety of different upstream hosts.
[2] http2_protocol_options - Indicate Envoy to use HTTP/2 when making new HTTP connection pool connections
Endpoints
We then configure load balancing based endpoint to distribute the traffic, in our case, to the upstream domain.
clusters:
  - name: service_clusterA
    connect_timeout: 30s
    type: logical_dns
    http2_protocol_options: {}
    dns_lookup_family: V4_ONLY
    load_assignment:
      cluster_name: service_clusterA
      endpoints:
      - lb_endpoints:
        - endpoint:
            address:
              socket_address:
                address: clusterA.prometheus.example.net
                port_value: 443
TLS
Since we had configured our ALB’s with certs on port 443, the proxying needs to happen over TLS.
clusters:
  - name: service_clusterA
    ...
    transport_socket:
      name: envoy.transport_sockets.tls
      typed_config:
        "@type": type.googleapis.com/envoy.extensions.transport_sockets.tls.v3.UpstreamTlsContext
        sni: example.com
        common_tls_context:
          alpn_protocols:
          - "h2"
Here, we configure the SNI and ALPN protocol (Transport Layer Security (TLS) extension that allows the application layer to negotiate which protocol should be performed over a secure connection in a manner that avoids additional round trips and which is independent of the application-layer protocols) to be used for the TLS connection.
Service Ports
Finally, you wrap up by configuring the listener ports in your service and container port configuration.
service:
  ports:
    clusterA:
      port: 10000
      targetPort: clusterA
      protocol: TCP

ports:
  clusterA:
    containerPort: 10000
    protocol: TCP
Thanos
Now that we have prometheus stack and envoy proxy running in the observer cluster, final piece is to install the thanos components such as:
| Thanos Querier | Thanos Querier essentially allows to aggregate and optionally deduplicate multiple metrics backends under single Prometheus Query endpoint. |
| Thanos Store | The thanos store command (also known as Store Gateway) implements the Store API on top of historical data in an object storage bucket. It acts primarily as an API gateway and therefore does not need significant amounts of local disk space. |
| Thanos Compactor | Applies the compaction procedure of the Prometheus 2.0 storage engine to block data stored in object storage It is also responsible for creating 5m downsampling for blocks larger than 40 hours (2d, 2w) and creating 1h downsampling for blocks larger than 10 days (2w) |
We make use of the helm chart repo [https://github.com/HarshadRanganathan/helm-thanos] and override the values for easy installation.
Let’s create a sample shared-values.yaml file with following configuration
image:
  tag: v0.18.0

sidecar:
  enabled: true
  namespace: platform

query:
  storeDNSDiscovery: true
  sidecarDNSDiscovery: true

store:
  enabled: true
  serviceAccount: "thanos-store"

bucket:
  enabled: true
  serviceAccount: "thanos-store"

compact:
  enabled: true
  serviceAccount: "thanos-store"

objstore:
  type: S3
  config:
    endpoint: s3.us-east-1.amazonaws.com
    sse_config:
      type: "SSE-S3"
Here, we basically enable the various components and mention Thanos to use S3 object storage.
Next, we create env specific values file for the hlem chart.
prod-values.yaml
objstore:
  config:
    # AWS S3 metrics bucket name
    bucket: <bucket_name>
First, we configure the S3 bucket name where the metrics are stored so that compactor can downsample them and the store API can access them as well.
Next, in the envoy proxy section we had configured listeners for each of the clusters that we want to pull the metrics.
So, we now point thanos to the envoy listener ports. Thanos querier will then query the various clusters and aggregate the query results.
query:
  stores:
    - dnssrv+_clusterA._tcp.envoy
  extraArgs:
    - "--rule=dnssrv+_clusterA._tcp.envoy"
    - "--rule=dnssrv+_grpc._tcp.thanos-sidecar-grpc.platform.svc.cluster.local"
Here, we use ‘dnssrv+’ scheme to detect Thanos API servers through respective DNS lookups.
dnssrv+ scheme - With DNS SD, a domain name can be specified and it will be periodically queried to discover a list of IPs.
The domain name after this prefix will be looked up as a SRV query, and then each SRV record will be looked up as an A/AAAA query. You do not need to specify a port as the one from the query results will be used.
The second rule in the config dnssrv+_grpc._tcp.thanos-sidecar-grpc.platform.svc.cluster.local is required so that Thanos Querier can connect to the thanos sidecar in the local prometheus instance (observer cluster)