Table Of Contents
OOMKilled - Container Memory Limit Reached
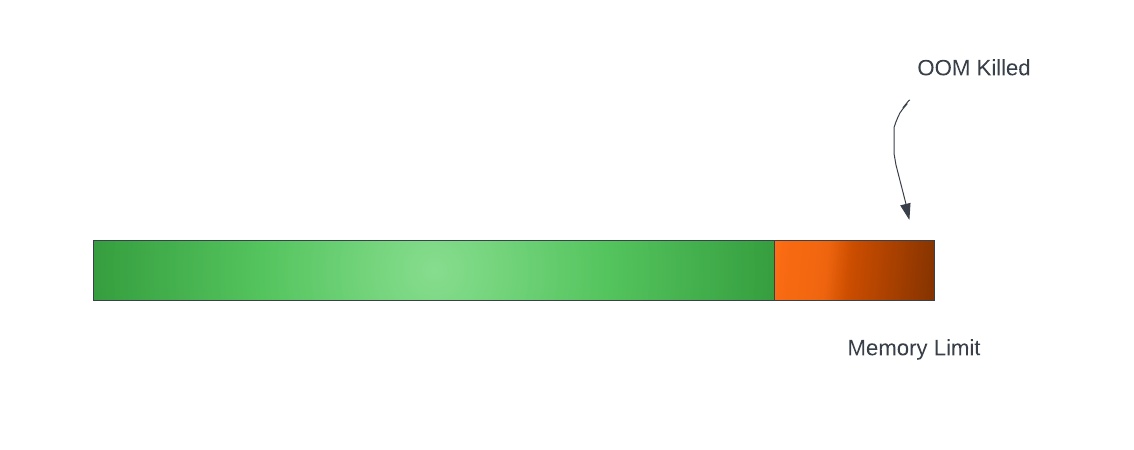
A Container is not allowed to use more than its memory limit.
If a Container allocates more memory than its limit, the Container becomes a candidate for termination.
If the Container continues to consume memory beyond its limit, the Container is terminated.
Consider this scenario, where a container has configured it’s memory limits to 512 MiB.
apiVersion: apps/v1
kind: Deployment
spec:
  replicas: 1
  template:
    spec:
      containers:
      - image: localhost:5000/apps/spring-boot-example
        name: k8s-spring-boot-example
        resources:
          limits:
            cpu: 500m
            memory: 512Mi
          requests:
            cpu: 125m
            memory: 512Mi
If the container tries to consume more memory than it’s configured limit of 512 MiB, it results in below error:
Last Status
terminated
Reason: OOMKilled - exit code: 137
If you are using the default restartPolicy which is set to Always, then your pod will get restarted automatically on OOM failure.
Failure Scenarios
A container may allocate more memory than your configured limit for the following reasons -
[1] Application is experiencing higher load than normal due to any of
- Increased traffic
- Increased queue consumption
- Increased in-memory data for processing e.g. certain requests result in db select queries returning huge volume of records for processing and subsequent publishing of the result to an output topic
[2] Application is having a memory leak
Actions
We should aim to take appropriate actions based on the root cause analysis instead of just going for the easy fix which is increasing the memory limit.
| Cause | Resolution |
|---|---|
| Application is having a memory leak | Debug the application and resolve the memory leak |
| Application is experiencing higher load than normal | Increase memory limit in the container specifications |
Approaches to Configuring Memory Limits
kubectl top command
kubectl top command returns current CPU and memory usage for a cluster’s pods or nodes.
Note - This requires Metrics server to be installed in your cluster
# Show metrics for a given pod and its containers
kubectl top pod POD_NAME --containers
For example, to view the resource consumption of all pods in all namespaces -
kubectl top pod -A
NAMESPACE     NAME                                        CPU(cores)   MEMORY(bytes)
grafana       grafana-5bcd5dbf74-rcx2d                    1m           22Mi
kube-system   coredns-6c46d74d64-d8k2z                    5m           10Mi
kube-system   metrics-server-ff9dbcb6c-8jqp6              36m          13Mi
So, to determine the appropriate memory limits, you could run the kubectl top command in watch mode and perform load tests.
Observe the memory consumption and determine appropriate values.
e.g.
$ watch kubectl top pod aws-fluent-bit-platform-2f6n8 --containers

Every 2.0s: kubectl top pod aws-fluent-bit-platform-2f6n8 --containers

POD                             NAME                 CPU(cores)   MEMORY(bytes)
aws-fluent-bit-platform-2f6n8   aws-for-fluent-bit   2m           36Mi
Prometheus & Grafana
VPA
Goldilocks
Goldilocks is a utility that can help you identify a starting point for resource requests and limits.
This tool creates a VPA in recommendation mode for each workload in a namespace and then queries them for information.
Once your VPAs are in place, you’ll see the recommendations appearing in the Goldilocks dashboard.
Installation
To install Goldilocks, run below commands in your cluster:
helm repo add fairwinds-stable https://charts.fairwinds.com/stable

## Installs only VPA recommender and not the admission webhook
helm install vpa fairwinds-stable/vpa --namespace vpa --create-namespace

helm install goldilocks fairwinds-stable/goldilocks --namespace goldilocks --create-namespace
If everything is successful, you can see the Goldilocks dashboard running with below comamnd:
$ kubectl get pods --namespace goldilocks -l "app.kubernetes.io/name=goldilocks,app.kubernetes.io/instance=goldilocks,app.kubernetes.io/component=dashboard" -o jsonpath="{.items[0].metadata.name}\n"

goldilocks-dashboard-9d494-4hejfj
Note - Default memory limits configured for goldilocks controller & dashboards deployments are quite low. If you are planning to run it against an namespace having huge number of pods then increase the memory limit to avoid OOMKilled state. Your dashboard won’t work properly without the goldilocks deployments in steady state.
Enable Namespace
Pick an application namespace and label it like so in order to see some data:
e.g.
kubectl label ns <namespace> goldilocks.fairwinds.com/enabled=true
After that you should start to see VPA objects in that namespace.
Dashboard
The default installation creates a ClusterIP service for the dashboard. You can access via port forward:
kubectl -n goldilocks port-forward svc/goldilocks-dashboard 8080:80
Then open your browser to http://localhost:8080
You can see Goldilocks showing recommendations such as below for your deployments:
Case Study
Let’s see some examples of how Goldilocks recommendations help us to tune the memory limits.
An app team has a container named logstash-exporter with below configuration -
apiVersion: apps/v1
kind: Deployment
spec:
  replicas: 1
  template:
    spec:
      containers:
      - image: localhost:5000/apps/logstash-exporter
        name: logstash-exporter
        resources:
          limits:
            cpu: 300m
            memory: 750Mi
          requests:
            cpu: 100m
            memory: 350Mi
We notice that they have configured memory requirements in the range of 350 - 750 MiB.
We enable VPA recommender for above using Goldilocks namespace enablement and then check the recommendations after a period of workload activity.
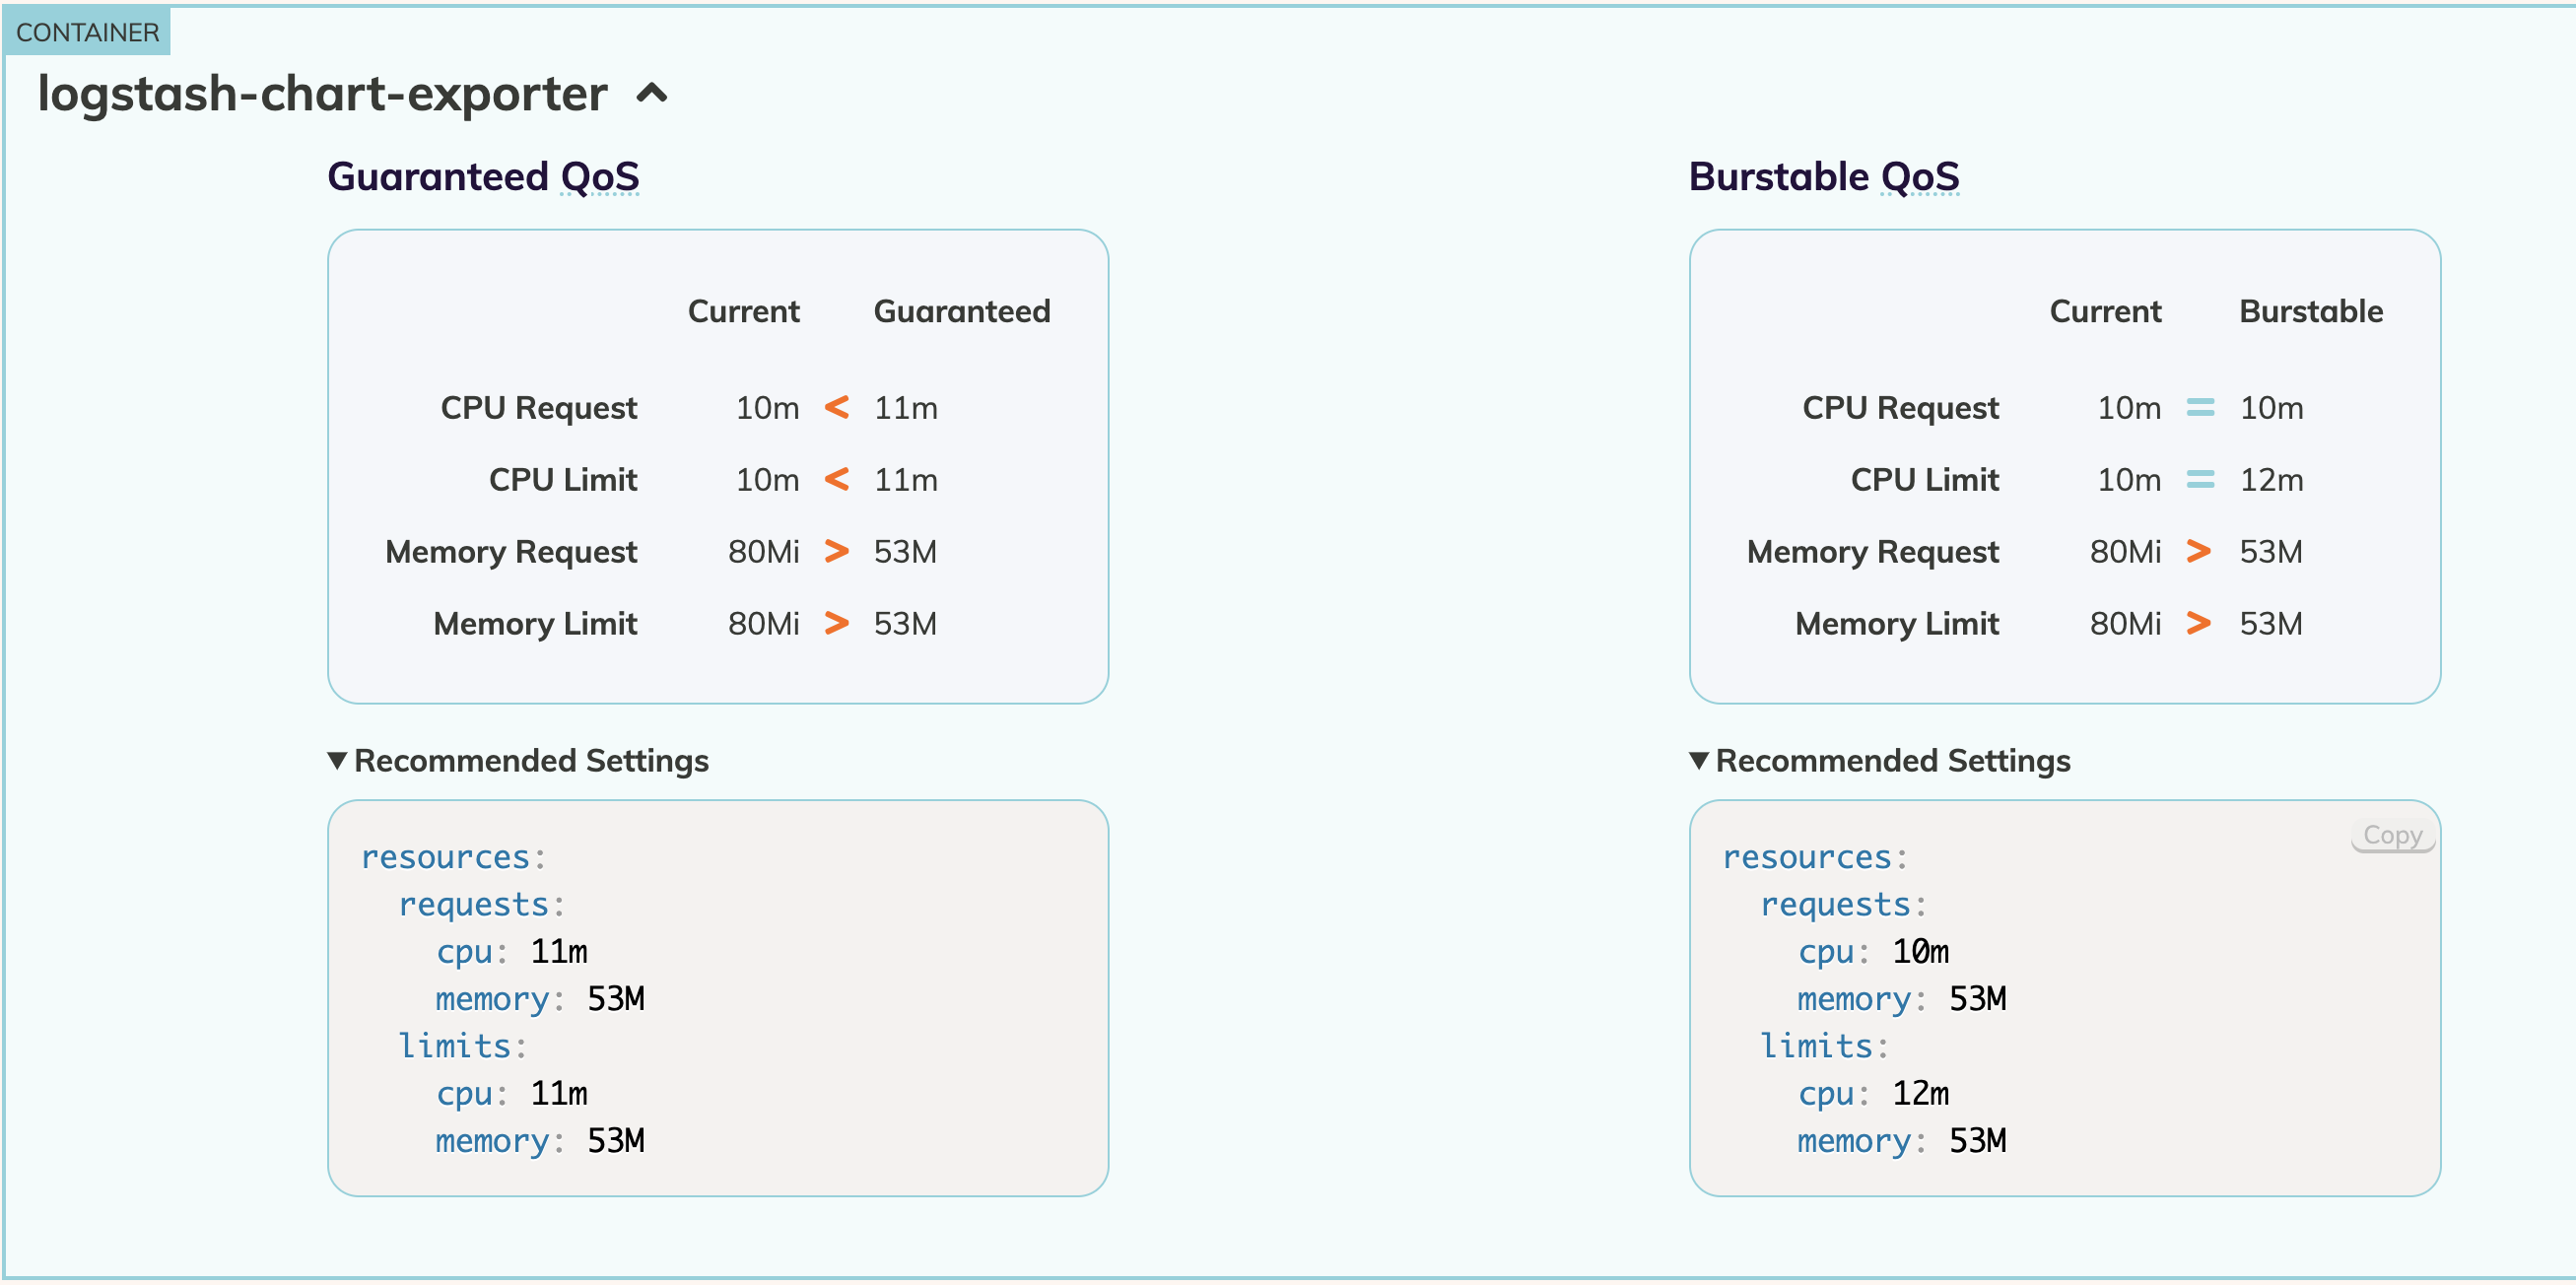
We could clearly see that this container requires a max of 53MiB to function whereas the original requirements was way above than what was needed.
We can then ask the app team to update the memory configuration based on the recommendations so that the unneeded memory could be released for other workloads usage.
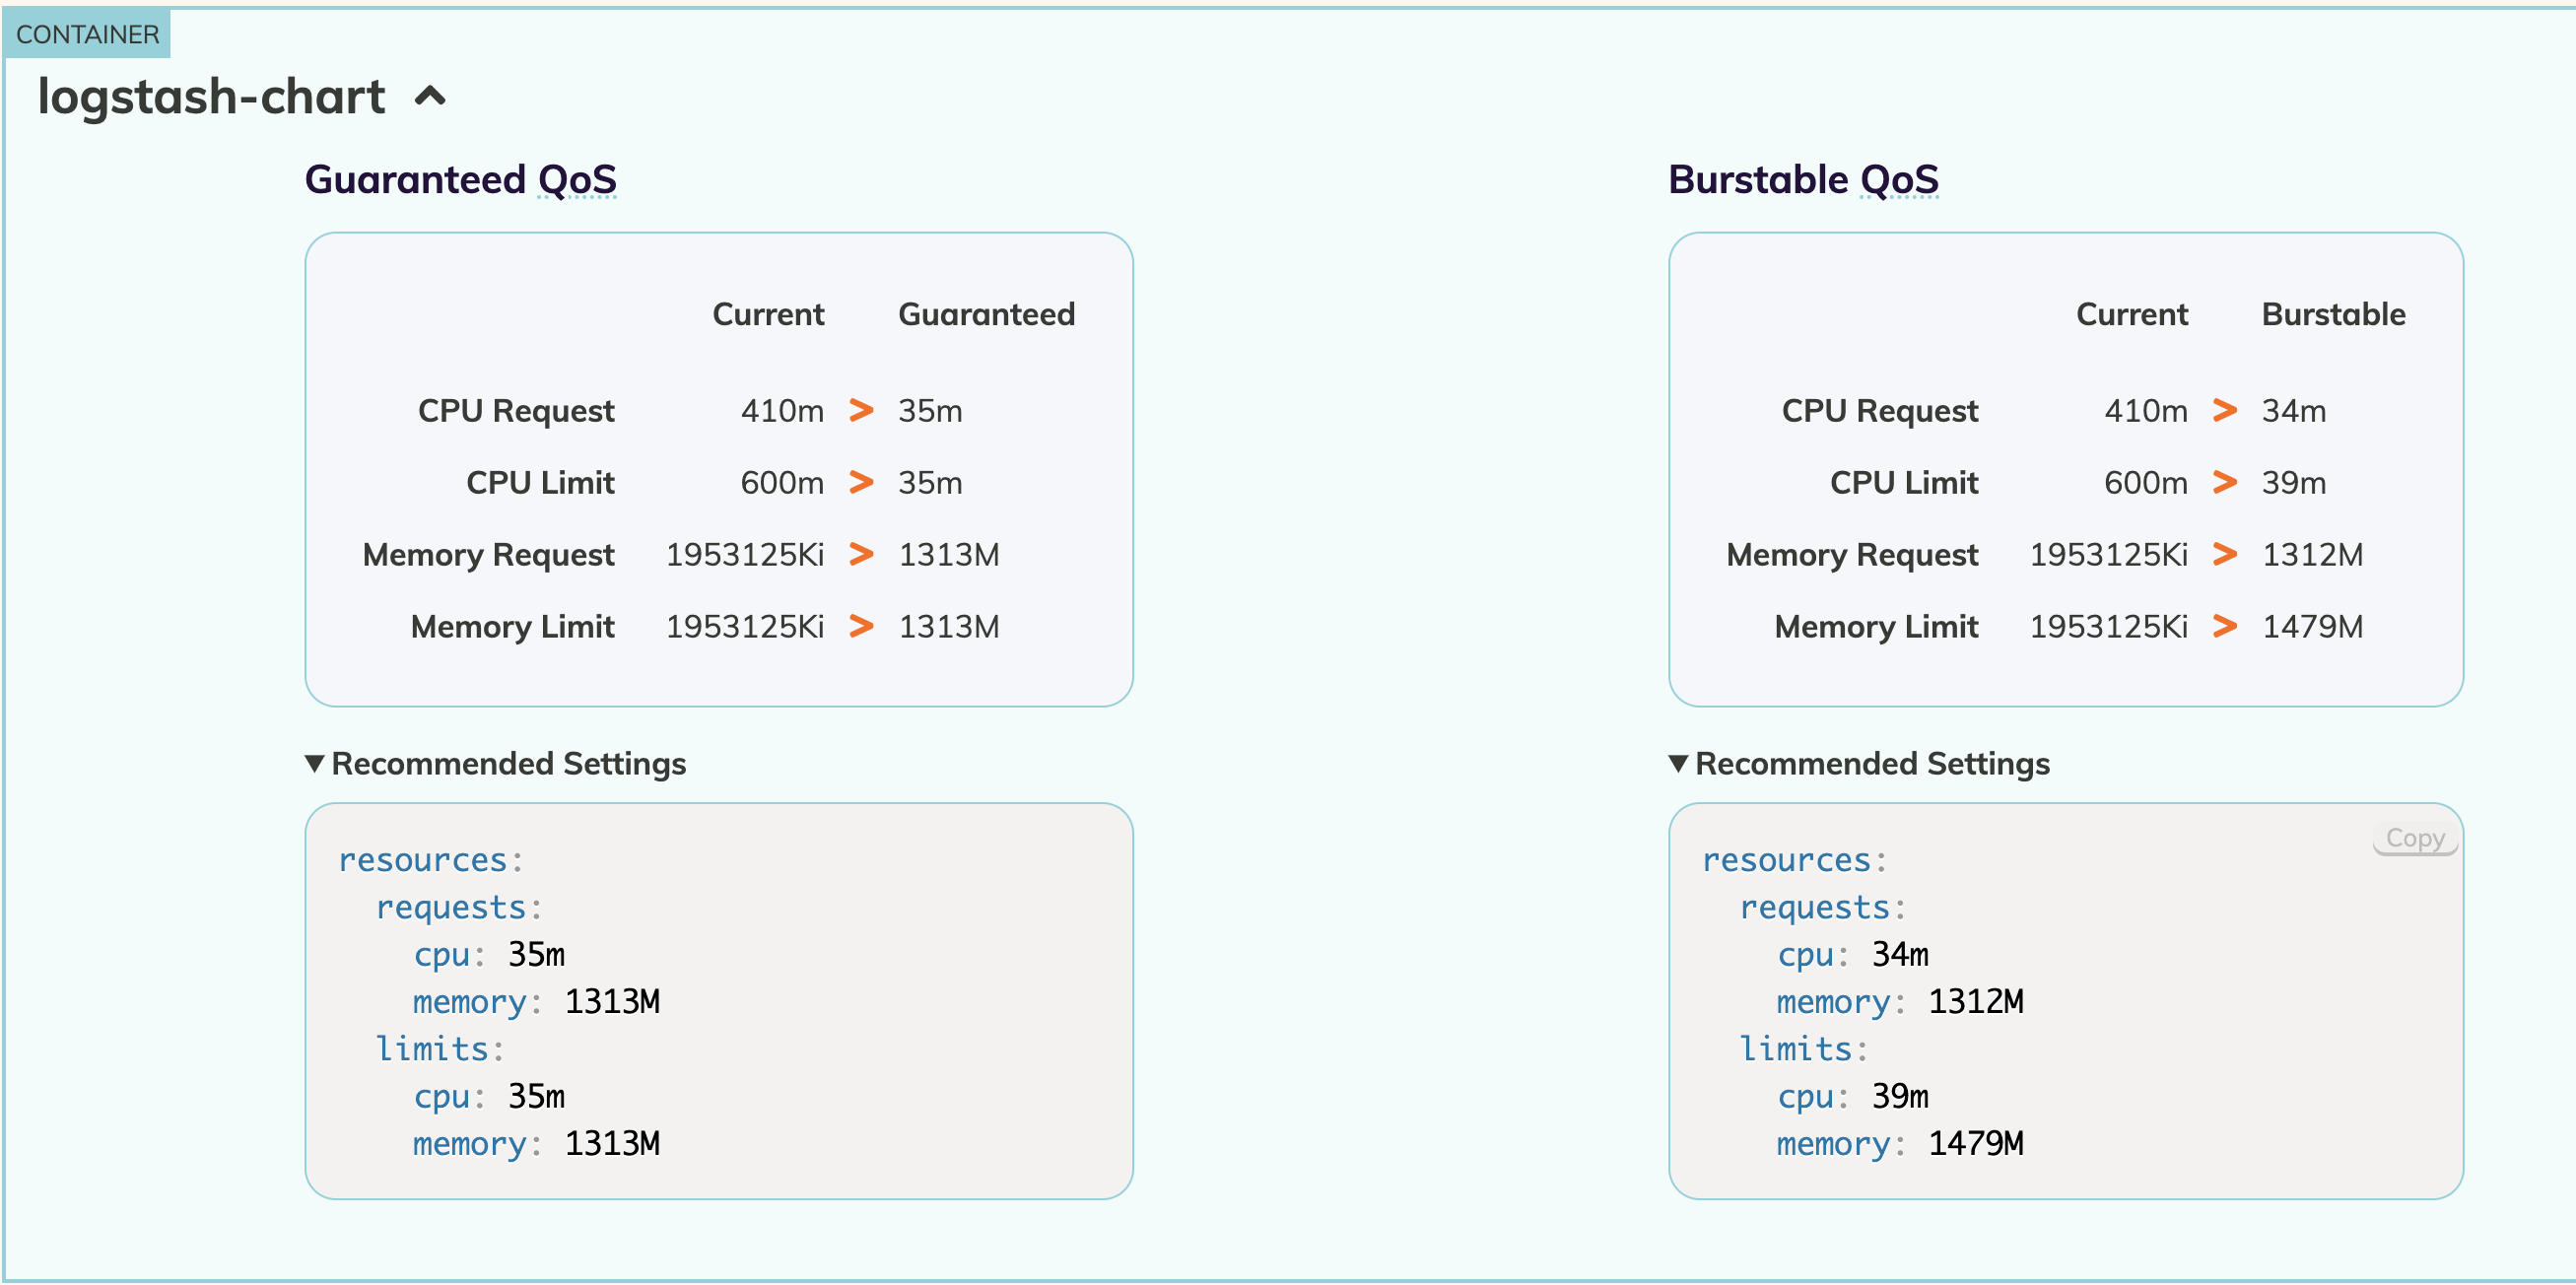
In an another example, an app team has configured a container named logstash-chart with below configuration -
apiVersion: apps/v1
kind: Deployment
spec:
  replicas: 1
  template:
    spec:
      containers:
      - image: localhost:5000/apps/logstash-chart
        name: logstash-chart
        resources:
          limits:
            cpu: 300m
            memory: 750Mi
          requests:
            cpu: 100m
            memory: 350Mi
We notice that the above configuration is resulting in OOMKilled state. So, we remove the limits and run the workloads to observe the recommendations.
We can see that the container requires a max of ~1300 MiB of memory to process based on the current load however we had configured a max of 750 MiB previously.
We then ask the app team to increase the memory limits so that the container can process without restarts (provided above is not related to a memory leak).