Table Of Contents
- Introduction
- Storage Layout
- Finding Container ID
- Find TopStorage Layers
- Disk Usage
- Scenario 1 - Local Log Files
- Scenario 2 - Container Image Size
- References
Introduction
Are you noticing any of the below things:
[1] Node has DiskPressure label
[2] Node has disk-pressure=undefined:NoSchedule taint
[3] Node is crashing and a new node has spun up
[4] Pods have Evicted state
[5] Cluster has events like
The node had condition: [DiskPressure]
The node was low on resource: ephemeral-storage. Container was using xxxKi, which exceeds its request of xx
failed to garbage collect required amount of images. Wanted to free xx bytes, but freed 0 bytes
Then you have come to the right place.
We will look at the steps to troubleshoot this issue and how to recover from it.
Storage Layout
EKS uses overlay2 as the Docker storage driver and you can find below layout in /var/lib/docker directory.
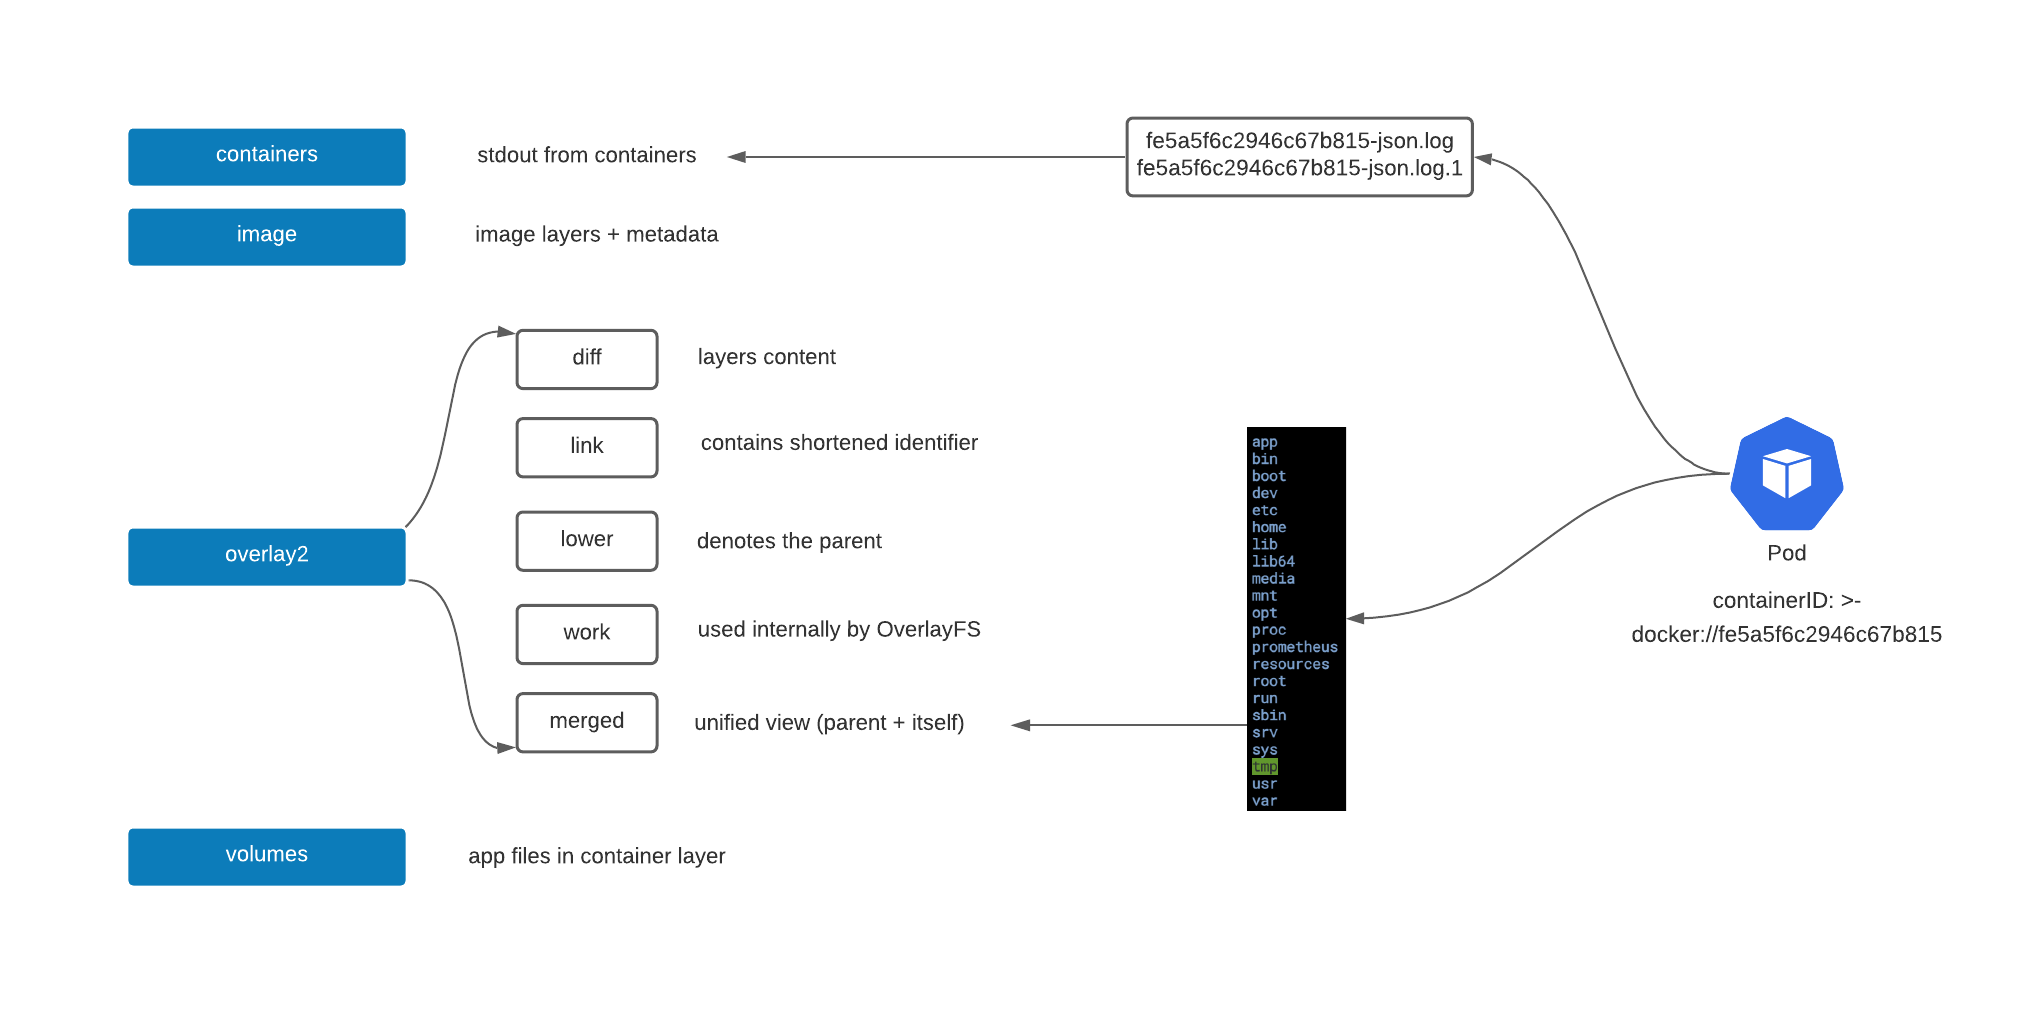
So, basically all your container’s log output from STDOUT goes to the containers directory.
All image layers content goes to overlay2 directory i.e. let’s say you have built your app with JDK image, all the jdk libs, custom files you add in your Dockerfile etc. you can find it here.
Finding Container ID
You can easily find out the container ID of a pod using below command:
kubectl get pods <pod-name> -o jsonpath="{..containerID}"
which will return something like docker://fe5a5f6c294
You can use the container ID to find out the logs/container contents in the various sub-directories.
Find TopStorage Layers
To find out the layers in overlay2 occupying most storage, you can run below command:
TOP_STORAGE=$(du -hs /var/lib/docker/overlay2/* | grep -Ee '^[0-9]{3}[M]+|[0-9]G' | sort -h |tail -n 10 |tee -a /dev/stderr |awk '{print $2}'|xargs|sed 's/ /|/g')

636M    /var/lib/docker/overlay2/dd170e9606b38b
659M    /var/lib/docker/overlay2/d7d87a0fa163ef
660M    /var/lib/docker/overlay2/1e5a623895093d
680M    /var/lib/docker/overlay2/a80c426824258d
You can see that we have many layers occupying 600Mb+ of storage.
Let’s see what containers they belong to:
docker inspect $(docker ps -q) | jq '.[]|.Config.Hostname,.Config.Labels."io.kubernetes.pod.name",.GraphDriver.Data.MergedDir,.hovno' | egrep -B2 "$TOP_STORAGE"

"web-app4tllp"
"/var/lib/docker/overlay2/1e5a623895093d/merged"
--
"web-app4tllp"
"/var/lib/docker/overlay2/b6ede2479b7569/merged"
--
Above command returned the pod name and corresponding overlay2 merged view location.
You can now explore the directories to find out what is occupying the storage.
For example, we go inside one of the overlay2 directories and run below disk usage command:
du -h --max-depth=1 . |sort -n

3.9M    ./sbin
3.9M    ./tmp
5.4M    ./bin
8.9M    ./var
9.4M    ./lib
12K     ./root
32K     ./resources
97M     ./app
497M    ./usr
626M    .
952K    ./etc
You can see that usr directory is occupying 497Mb and this is could be from your base image e.g. JDK libs etc.
Disk Usage
You can run below command to see overall disk usage for all directories:
df -hT
This would also give you an idea as to what’s consuming more storage.
Scenario 1 - Local Log Files
In this scenario, apps might be writing logs to local file instead of STDOUT causing the disk storage to fill up fast.
In order to find out if any pods are doing it, you need to triangulate the app which may be causing the issue - filter out pods that you suspect might be causing the issue.
Some pointers could be -
[1] when does the disk pressure happen? when performance tests run for a specific app?
[2] In the running pods, check the disk usage and compare it with overlay2 directory. If you notice something amiss, check further.
For example, run this command inside one of the pods -
du -h --max-depth=1 . |sort -n

3.9M    ./sbin
3.9M    ./tmp
5.4M    ./bin
8.9M    ./var
9.4M    ./lib
12K     ./root
32K     ./resources
500M    ./app
497M    ./usr
626M    .
952K    ./etc
We see that the app directory is occupying 500Mb of storage so we check what files are present inside.
To our surprise, we notice logs.txt file inside the app sub-directory and on further investigation we come to know that the app team have a log file appender configured so the logs are written to a local log file and never cleaned up.
Sample log4j settings file in a Spring boot app asking to append logs to logs/log.txt file:
<File name="LogToFile" fileName="logs/log.txt">
    <PatternLayout>
        <pattern>{ "date_time":"%date","log_message":"%msg" }%n</pattern>
    </PatternLayout>
</File>
Any logs you write to STDOUT end up in the containers directory which is rotated based on size and you could have a log forwarder configured at cluster level which pushes them to an external sink e.g. cloudwatch, ELK, Splunk etc. Once the logs are forwarded they are deleted from the cluster by the forwarder.
However, any file written by the app in the local container directory is not cleaned up by any process. So, the logs keep appending and grow forever based on the configured log settings.
You then ask the app team to fix the log settings to solve the issue.
Scenario 2 - Container Image Size
In this scenario, you might have several docker images which are larger in size causing the storage to fill up fast.
We follow the same steps as outlined above to find apps which are larger in size.
For example, we run below command to find layers occupying most storage -
TOP_STORAGE=$(du -hs /var/lib/docker/overlay2/* | grep -Ee '^[0-9]{3}[M]+|[0-9]G' | sort -h |tail -n 10 |tee -a /dev/stderr |awk '{print$2}'|xargs|sed 's/ /|/g')
1.8G    /var/lib/docker/overlay2/96a6173871b5bdd0176897b8c5c961a8dfe654fc0ba4b03e1ffb430559d74848
3.1G    /var/lib/docker/overlay2/10aaa9c4002dd6780db00db5ab434df13f465e7598c05a727e7c88a1ad8806d9
3.1G    /var/lib/docker/overlay2/ec47f6e8d88997a06aac4e1ee4232f19b9b1c89600d14a413803d73d8877f79d
3.3G    /var/lib/docker/overlay2/33d9accb90bf93dbf486cc2374f238aaea5cc41295f9d2992bdd24a7fc799e7c
3.3G    /var/lib/docker/overlay2/8c66a97fd2db6f8a96d6b93ebd9289f57334024bcbaa6dec3cbeeaf346470ed3
We can see that we have several layers which are taking up ~ 3Gb of storage space.
We then see what containers they belong to -
docker inspect $(docker ps -q) | jq '.[]|.Config.Hostname,.Config.Labels."io.kubernetes.pod.name",.GraphDriver.Data.MergedDir,.hovno' | grep -B2 "$TOP_STORAGE"
"graphql-productA-api"
"/var/lib/docker/overlay2/8c66a97fd2db6f8a96d6b93ebd9289f57334024bcbaa6dec3cbeeaf346470ed3/merged"
--
"graphql-productB-api"
"/var/lib/docker/overlay2/33d9accb90bf93dbf486cc2374f238aaea5cc41295f9d2992bdd24a7fc799e7c/merged"
--
"graphql-productC-api"
"/var/lib/docker/overlay2/ec47f6e8d88997a06aac4e1ee4232f19b9b1c89600d14a413803d73d8877f79d/merged"
We can see that the containers belonging to GraphQL (node.js) apps are occupying ~3 Gb of storage each.
We then proceed to examine the pod to see why they are taking up so much storage.
du -h --max-depth=1 . |sort -n
2.4G    .
2.4G    ./node_modules
4.0K    ./scripts
12K     ./chart
84K     ./config
120K    ./src
788K    ./.git
Here, we notice that node_modules dependency folder is occupying 2.4G of storage.
Depending on the node size and number of such pods stacked in the same node increases, storage might get quickly filled up.
For example, if you have a node with EBS volume of 20 Gb attached, 9-10 pods of above container will cause DiskPressure (assuming they are all on the same node).
You have couple of action items based on your analysis -
[1] As a quick fix, proceed to increase the EBS volume size of your nodes
[2] Ask the app teams to reduce the container image size by removing unnecessary dependencies, slim base images etc.
[3] If there are no further options to exhaust, you can have a larger EBS volume to accommodate the images.
[4] Switch to EFS storage for your EKS cluster which is pay-as-you go and scales however there is A price increase compared to using EBS.
References
https://docs.docker.com/storage/storagedriver/overlayfs-driver/