Table Of Contents
- Introduction
- Installation
- Getting Started
- Performance And Tuning
- Running Your Tests
- Generate Reports
- References
Introduction
Apache JMeter is a Java application designed to load test functional behavior and measure performance.
Apache JMeter may be used to test performance both on static and dynamic resources, Web dynamic applications.
It can be used to simulate a heavy load on a server, group of servers, network or object to test its strength or to analyze overall performance under different load types.
Installation
Java
JMeter is a java based application and hence it requires Java to be available in your machine.
Check if you have Java installed by running below command:
$ java -version

openjdk version "1.8.0_242"
OpenJDK Runtime Environment (build 1.8.0_242-b08)
OpenJDK 64-Bit Server VM (build 25.242-b08, mixed mode)
If you don’t have Java installed in your machine, then download and install it from Open JDK.
If you want to install Java in your AWS EC2 machine, then below is the command:
sudo yum install java-1.8.0-openjdk
JMeter
You can download the JMeter files from JMeter Releases.
If you are in a linux based system, you can use wget to download the file:
# Mirror download link for the latest version of JMeter can be found at https://jmeter.apache.org/download_jmeter.cgi
wget http://mirrors.ibiblio.org/apache//jmeter/binaries/apache-jmeter-5.2.1.tgz

# Untar the archive file
tar -xf apache-jmeter-5.2.1.tgz

# Go to the bin directory where the JMeter scripts will be available
cd apache-jmeter-5.2.1/bin
Getting Started
For our guide, we will be looking at the steps to load test a REST API.
Run the JMeter in GUI mode to create the scripts. Incase of windows, this can be done by running ApacheJMeter.jar file.
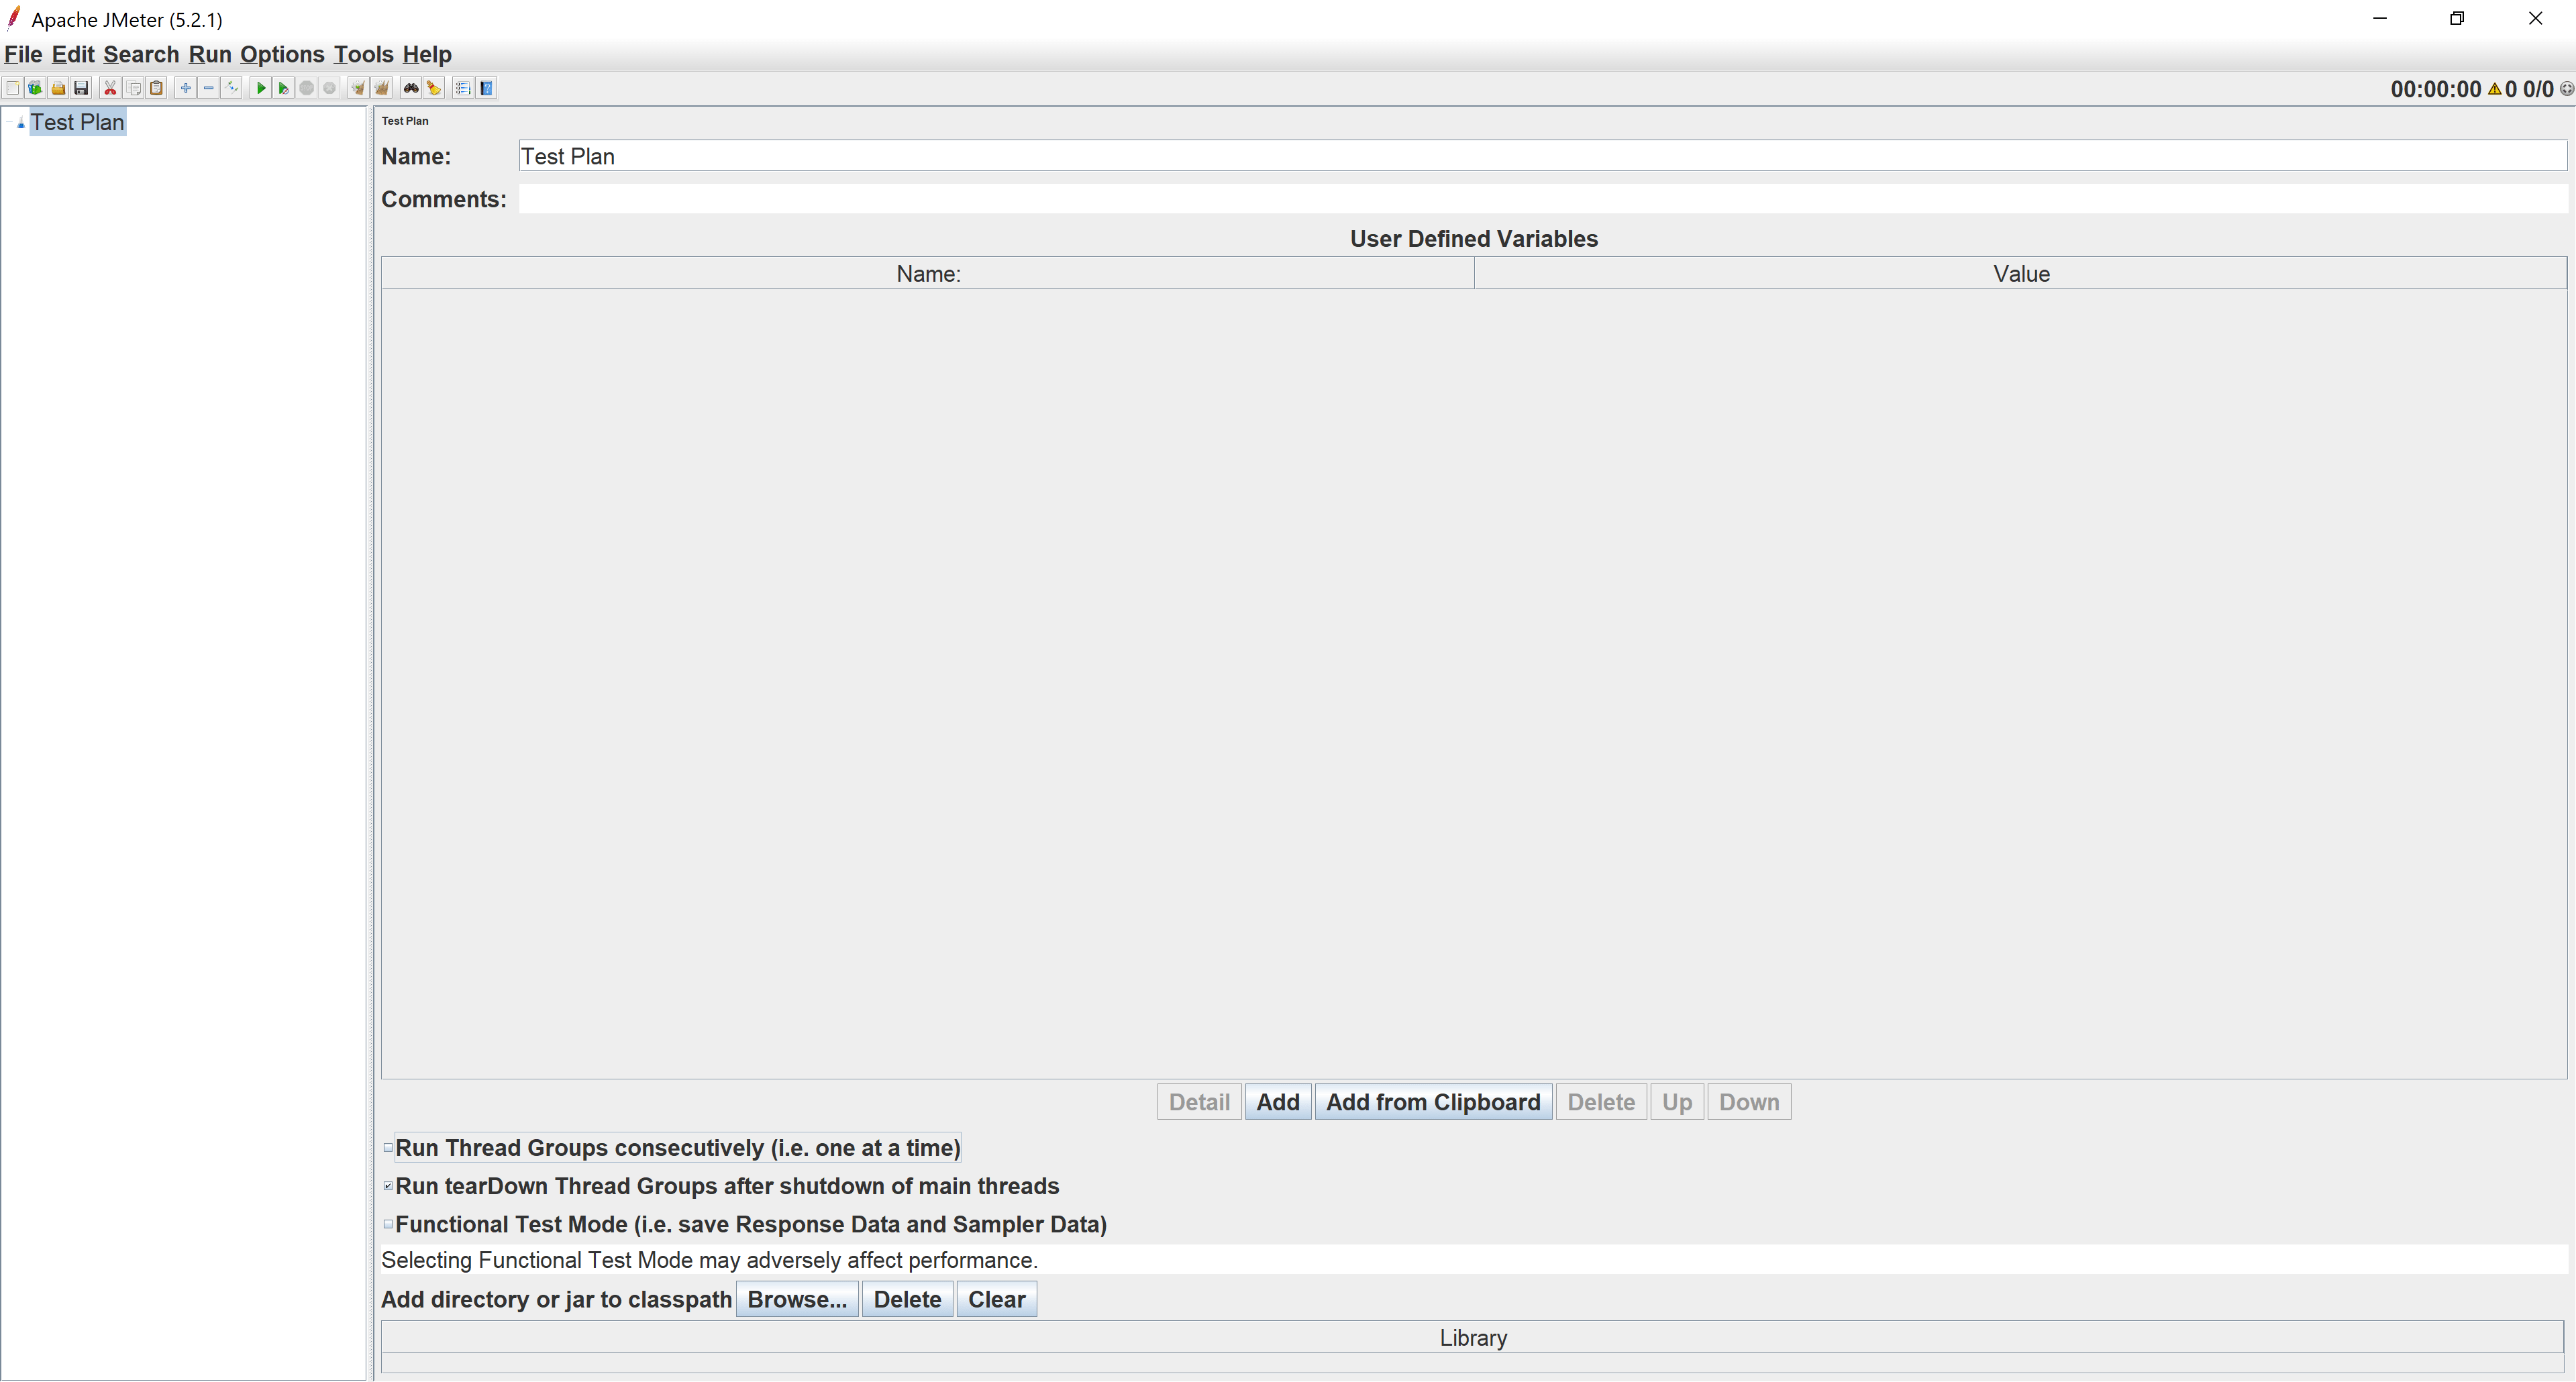
Test Plan
JMeter GUI will open up with a default test plan.
You can change the name of the test plan as required.
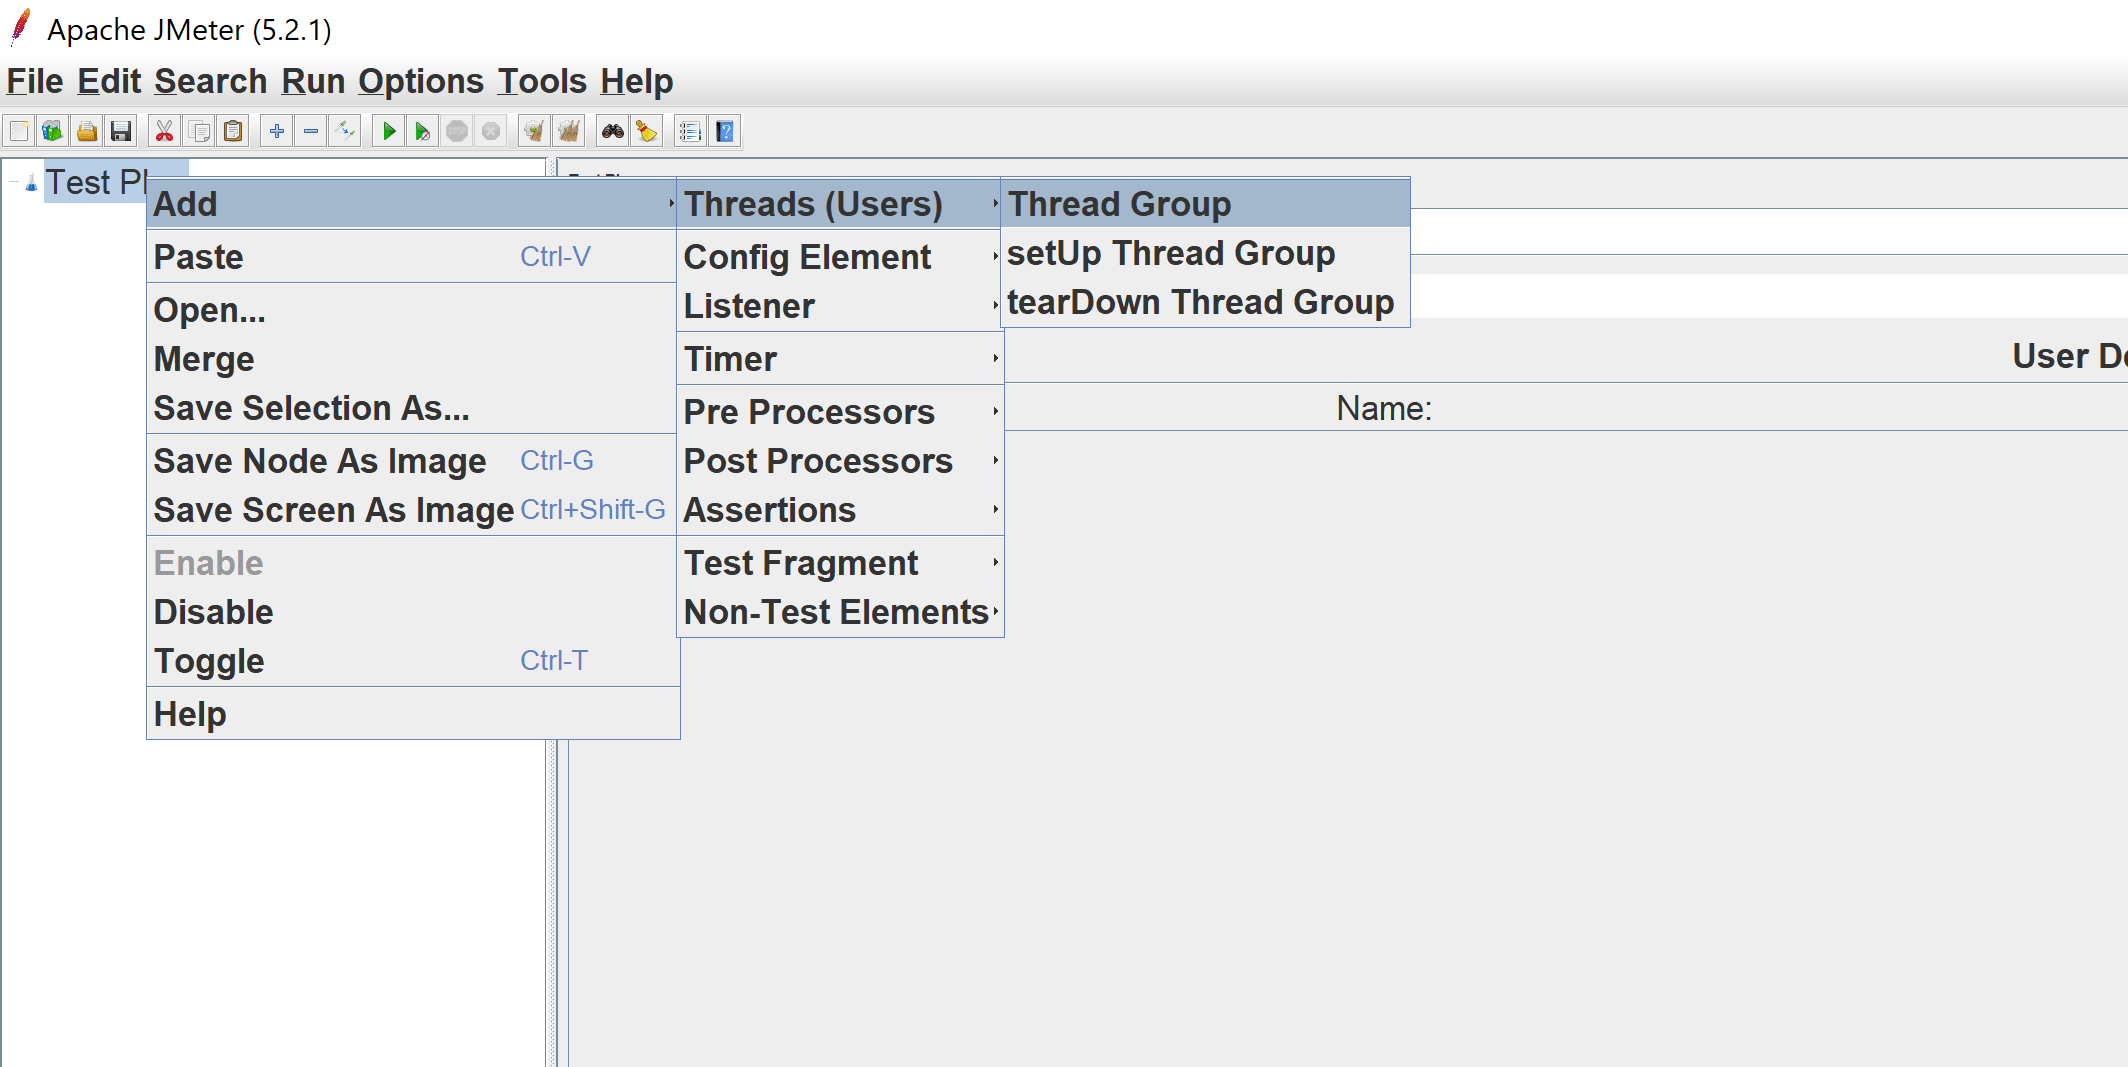
Thread Group
Next, we add a Thread Group to our test plan.
A Thread Group defines a pool of users that will execute a particular test case against your server.
In the Thread Group GUI, you can control the number of users simulated (number of threads), the ramp up time (how long it takes to start all the threads), the number of times to perform the test, and optionally, a start and stop time for the test.
HTTP Options
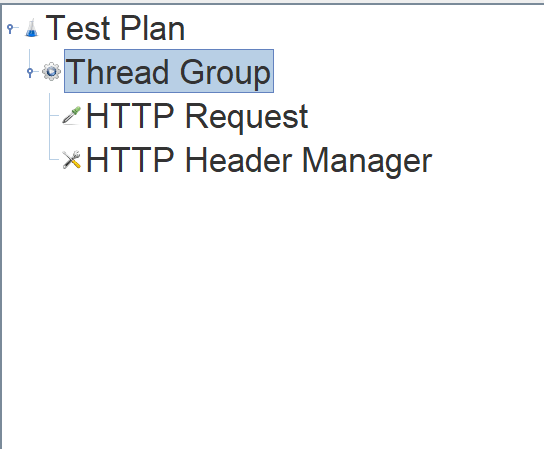
Since we are going to perform our load test against a REST API, we require HTTP Request Sampler with options to send headers.
HTTP Request Sampler lets you send an HTTP/HTTPS request to a web server. It also lets you control whether or not JMeter parses HTML files for images and other embedded resources and sends HTTP requests to retrieve them.
Following the same approach we did for adding a thread group, add HTTP Request Sample and HTTP Header Manager by selecting these options from your thread group -
Add -> Sampler -> HTTP Request
Add -> Config Element -> HTTP Header Manager
We will look at configuring these options in our performance and tuning section.
Performance And Tuning
Use Latest Version of JMeter
Performance of JMeter is being constantly improved so always use the latest version of the software available.
Parameterize Tests
Often it is useful to be able to re-run the same test with different settings. For example, changing the number of threads or loops, or changing a hostname.
One solution to this is to define the Test Plan variable in terms of a property, for example LOOPS=${__P(loops,10)}. This uses the value of the property “loops”, defaulting to 10 if the property is not found.
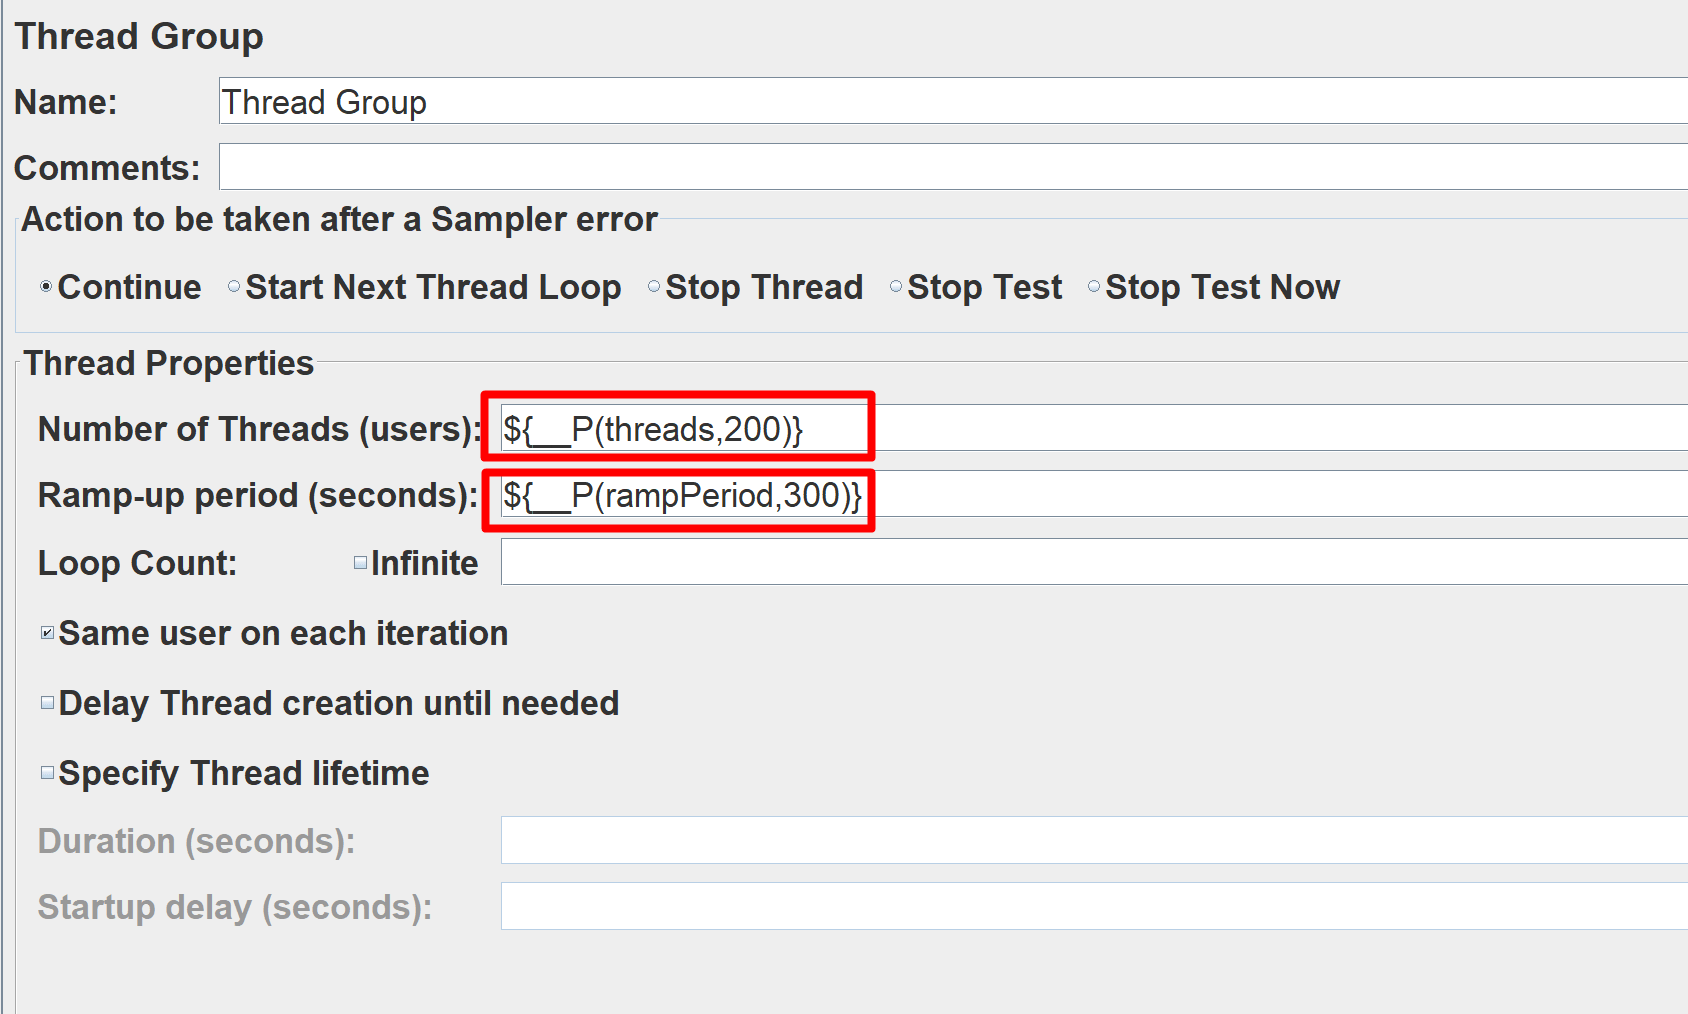
So, let’s parameterize all of our required settings.
In our thread group, we will configure Number of Threads and Ramp-up Period to use parameters with some defaults as shown below. We’ll look at what these settings mean later.
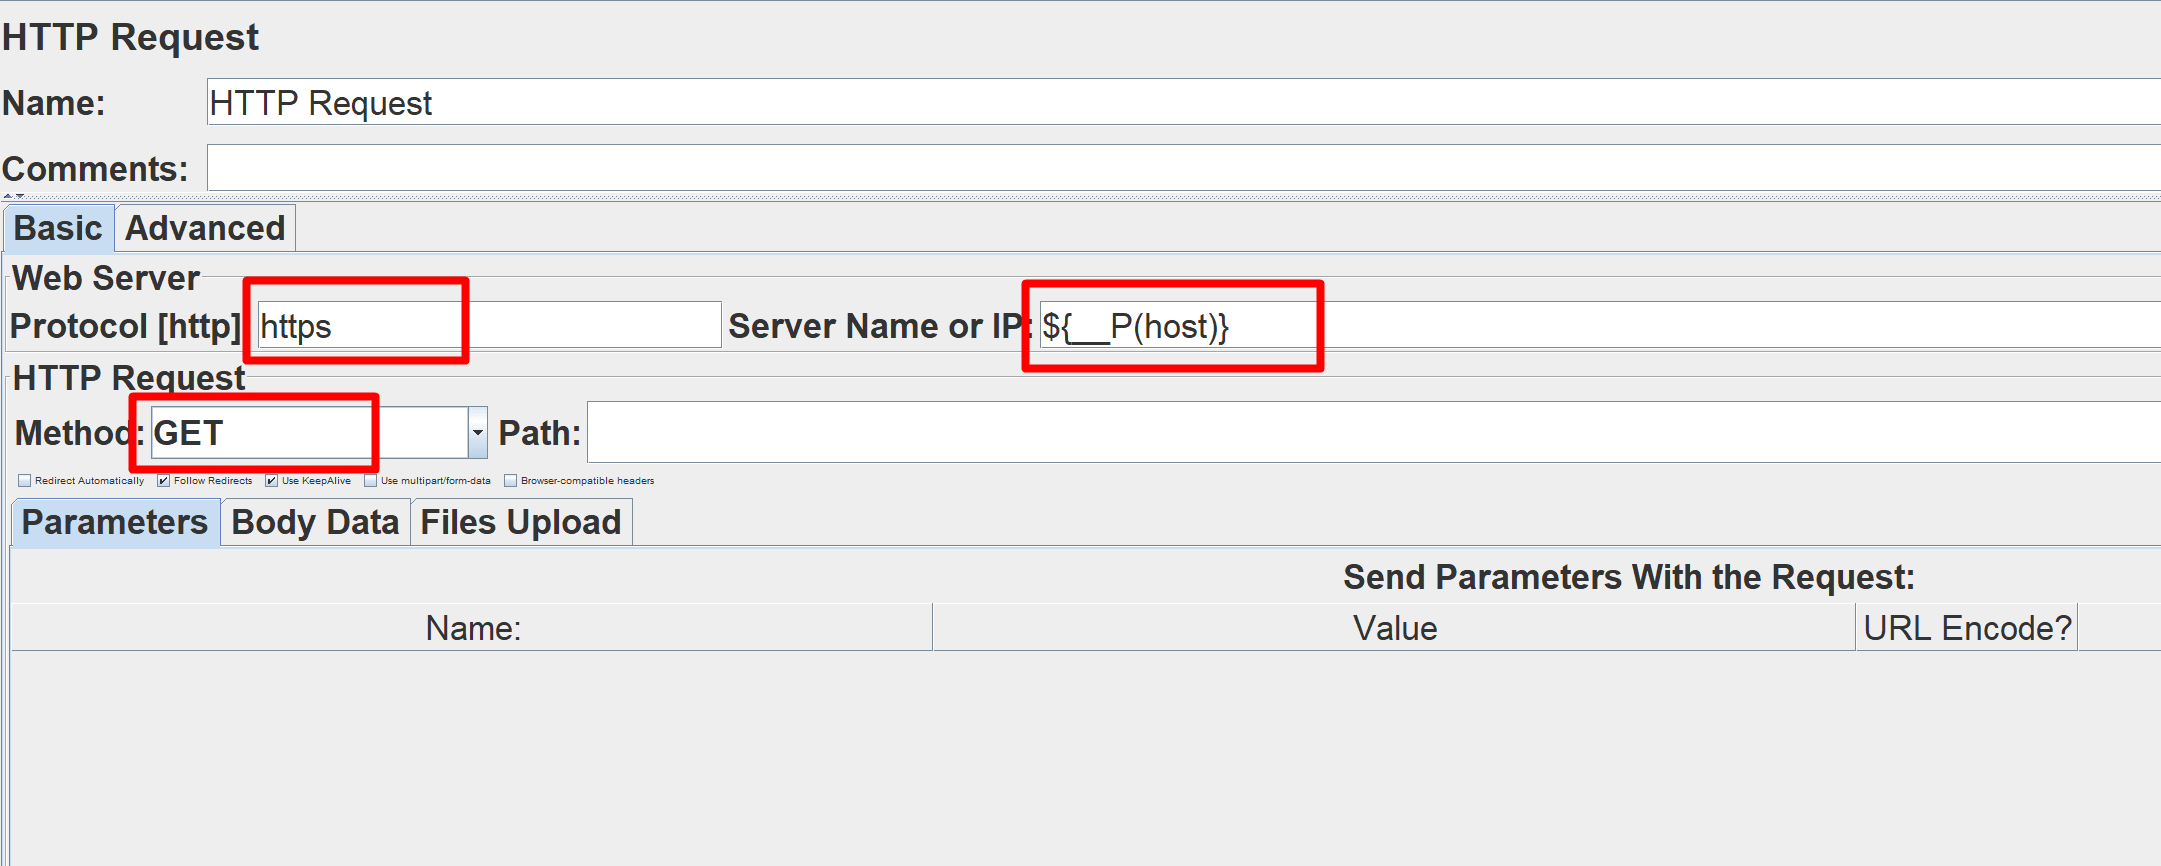
Similarly, in the HTTP Request, you can give the protocol, Method, and any other content required for your REST API. Here, we configure the Server Name to use host parameter.
Use CSV Dataset For Sampling
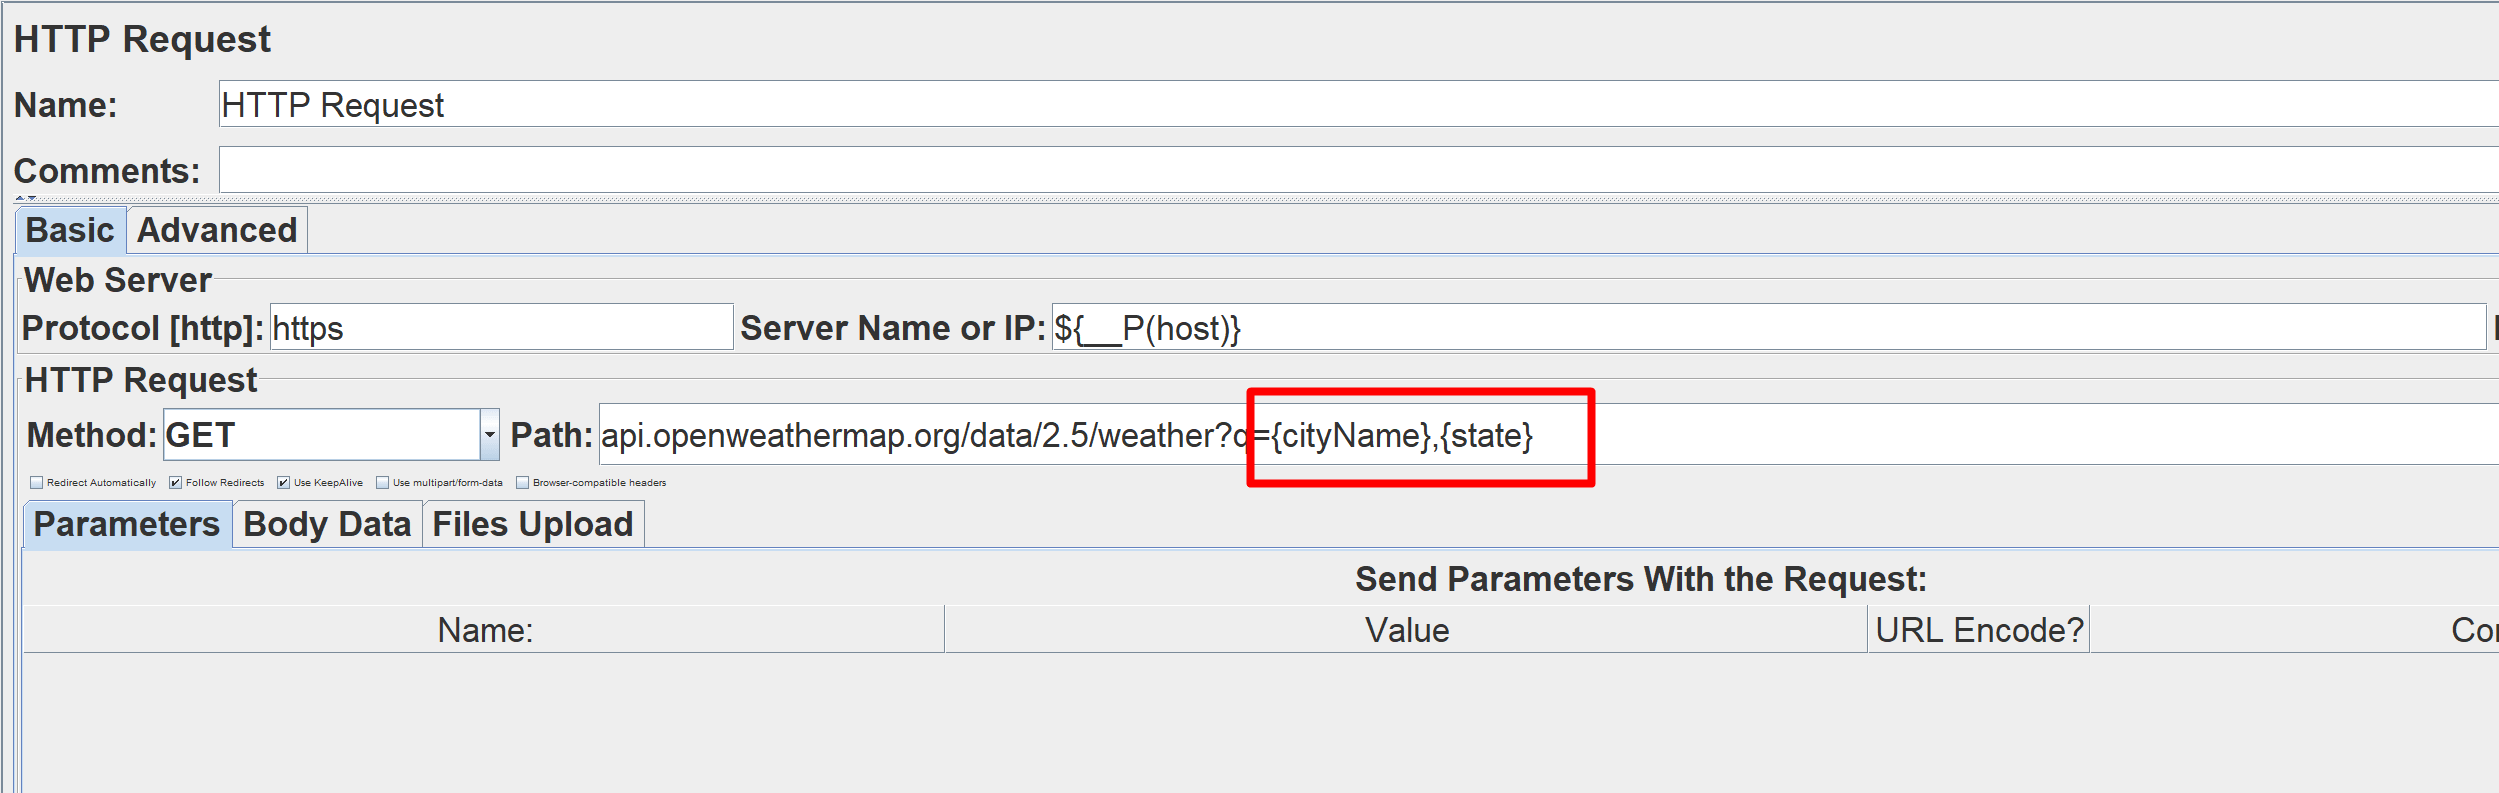
For example, let’s say we are going to load test OpenWeatherMap API with sample endpoint being api.openweathermap.org/data/2.5/weather?q={cityName},{state}
Here, cityName and state are two variables where you can substitute the values to get responses.
For our sampling, we could have a CSV file which contains values for cityName and state.
cityName,state
Jamestown,Washington
Montour,Iowa
Winesburg,Ohio
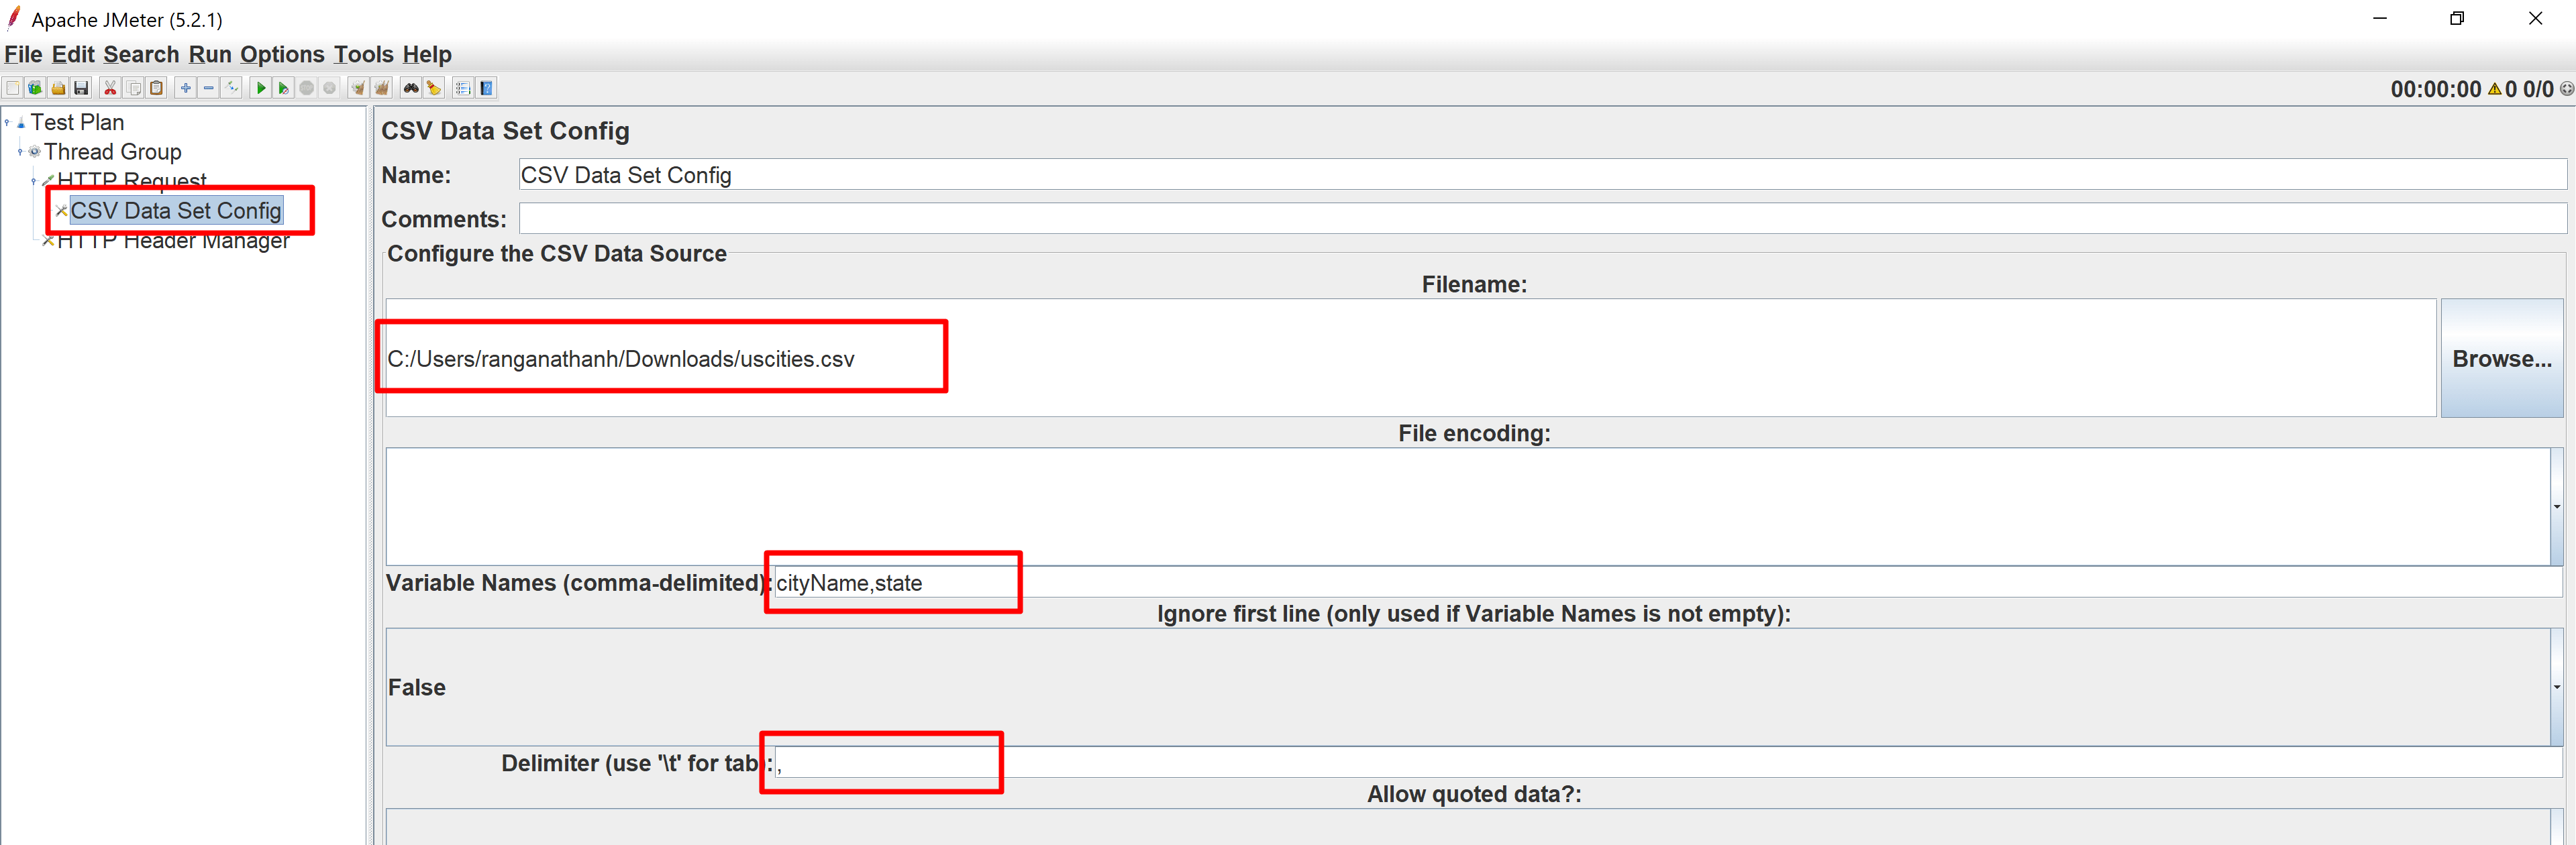
We could then use CSV Data Set Config to read lines from the csv file and split them into variables. These variables could then be used in our HTTP Request config for the path parameter.
To use CSV Data Set Config choose Add -> Config -> CSV Data Set Config under HTTP Request Config.
You can then provide the file location and variable names (should match csv columns).
In your HTTP Request config you can just use the variable names provided in CSV dataset config for your path parameter as shown below:
Use Sampler Loop
Rather than using lots of similar samplers, use the same sampler in a loop.
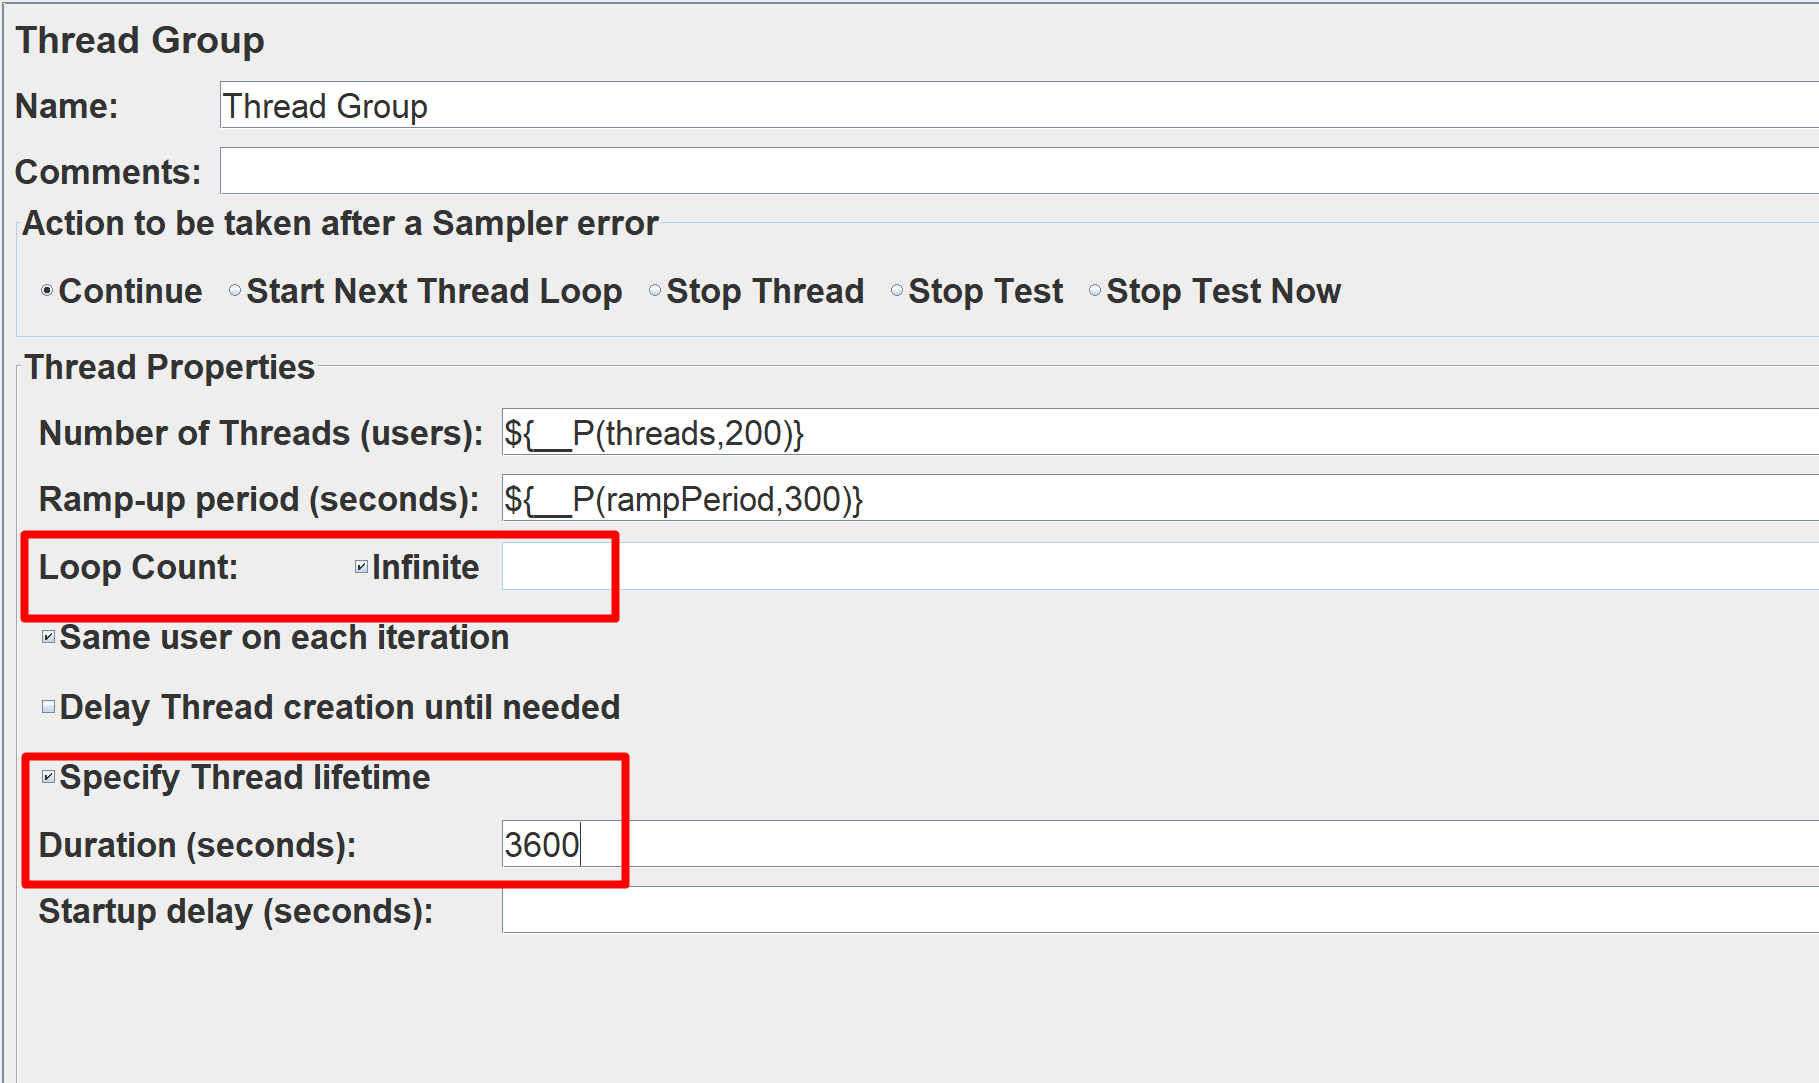
In your ThreadGroup, you can just configure to loop the csv dataset sample which we had configured earlier to an infinite/finite duration with the scheduler as shown below.
Here, we have said to loop the samples for 1 Hour duration.
Use Few Listeners As Possible
Use as few Listeners as possible.
Don’t use “View Results Tree” or “View Results in Table” listeners during the load test, use them only during scripting phase to debug your scripts.
Use CSV Output
Use CSV output rather than XML.
XML is verbose, it takes resources to be written (CPU and memory) and for analysis, CSV is great so forget about XML. Furthermore, for massive load tests there are many result data you don’t need.
So, update your user.properties file inside bin directory with below recommended settings:
jmeter.save.saveservice.output_format=csv
jmeter.save.saveservice.data_type=false
jmeter.save.saveservice.label=true
jmeter.save.saveservice.response_code=true
jmeter.save.saveservice.response_data.on_error=false
jmeter.save.saveservice.response_message=true
jmeter.save.saveservice.successful=true
jmeter.save.saveservice.thread_name=true
jmeter.save.saveservice.time=true
jmeter.save.saveservice.subresults=false
jmeter.save.saveservice.assertions=false
jmeter.save.saveservice.latency=true
jmeter.save.saveservice.bytes=true
jmeter.save.saveservice.hostname=true
jmeter.save.saveservice.thread_counts=true
jmeter.save.saveservice.sample_count=true
jmeter.save.saveservice.response_message=false
jmeter.save.saveservice.assertion_results_failure_message=false
jmeter.save.saveservice.timestamp_format=yyyy/MM/dd HH:mm:ss.SSS
jmeter.save.saveservice.default_delimiter=,
jmeter.save.saveservice.print_field_names=true
Increase Java Heap Size
The JMeter process runs in the Java Virtual Machine (JVM) under various settings and arguments. The Java Heap Space (as referred to in the error message) is the memory the JVM takes from the underlying operating system to allocate space for the creation of necessary objects.
JMeter comes with default heap size configuration of 1g. If you’re planning to do heavy load test then you can increase the heap size based on your available system memory.
For example, in jmeter script file, we can update the heap size to use 4g memory.
: "${HEAP:="-Xms4g -Xmx4g -XX:MaxMetaspaceSize=256m"}"
Threads And RampUp Period
The number of threads to use depends on many factors and you have to test it for yourself.
Some Factors:
- Machine power
- JVM 32/64 bit
- Heap Size
- OS
- Test Plan
Typically, people start with 200 threads and see how it goes.
The ramp-up period tells JMeter how long to take to “ramp-up” to the full number of threads chosen.
If 10 threads are used, and the ramp-up period is 100 seconds, then JMeter will take 100 seconds to get all 10 threads up and running. Each thread will start 10 (100/10) seconds after the previous thread was begun
If you start all of your threads at the same time, you will cause an initial peak rate to your server and you might want to avoid it.
Also, you might get Non HTTP response code: java.net.SocketException errors in your tests. So, it’s good to enable Delay Thread creation until needed option in the ThreadGroup.
CPU Utilization
Make sure your CPU utilization doesn’t exceed more than 80%. If it exceeds, JMeter will end up spending more time processing the responses and it might affect the response time, thereby skewing the results.
Use CLI Mode
Once you have the test scripts ready, run the test in CLI mode instead of GUI mode.
NEVER run a load test on the JMeter GUI. Use it only for test recording, development, and debugging. JMeter is simply not designed to produce high loads in GUI mode, which means that it will not only freeze - but it will also consume loads of resources and produce unreliable load test results.
./jmeter -n -t test.jmx -l test.jtl
Running Your Tests
Save Test Plan
When you have your script ready, you can right click your Test Plan and choose Save Selection As… option to save your script file.
Running Tests
To run JMeter in CLI mode, you can use below sample command:
./jmeter -n -t /home/ec2-user/test.jmx -l /home/ec2-user/result.csv -Jthreads=200 -JrampPeriod=60 -Jduration=3600
-n - this specifies JMeter is to run in non-gui mode -t - name of JMX file that contains the Test Plan -l - name of JTL file to log sample results to
Remember, we had given parameters ${__P(threads,200)} in our test plan. We supply values for those using -J option.
If you need to run your tests in the background,
nohup ./jmeter -n -t /home/ec2-user/test.jmx -l /home/ec2-user/result.csv -Jthreads=200 -JrampPeriod=60 -Jduration=3600 &

# tail the nohup file
tail -f nohup.out
If you need to stop your tests, run:
./stoptest.sh
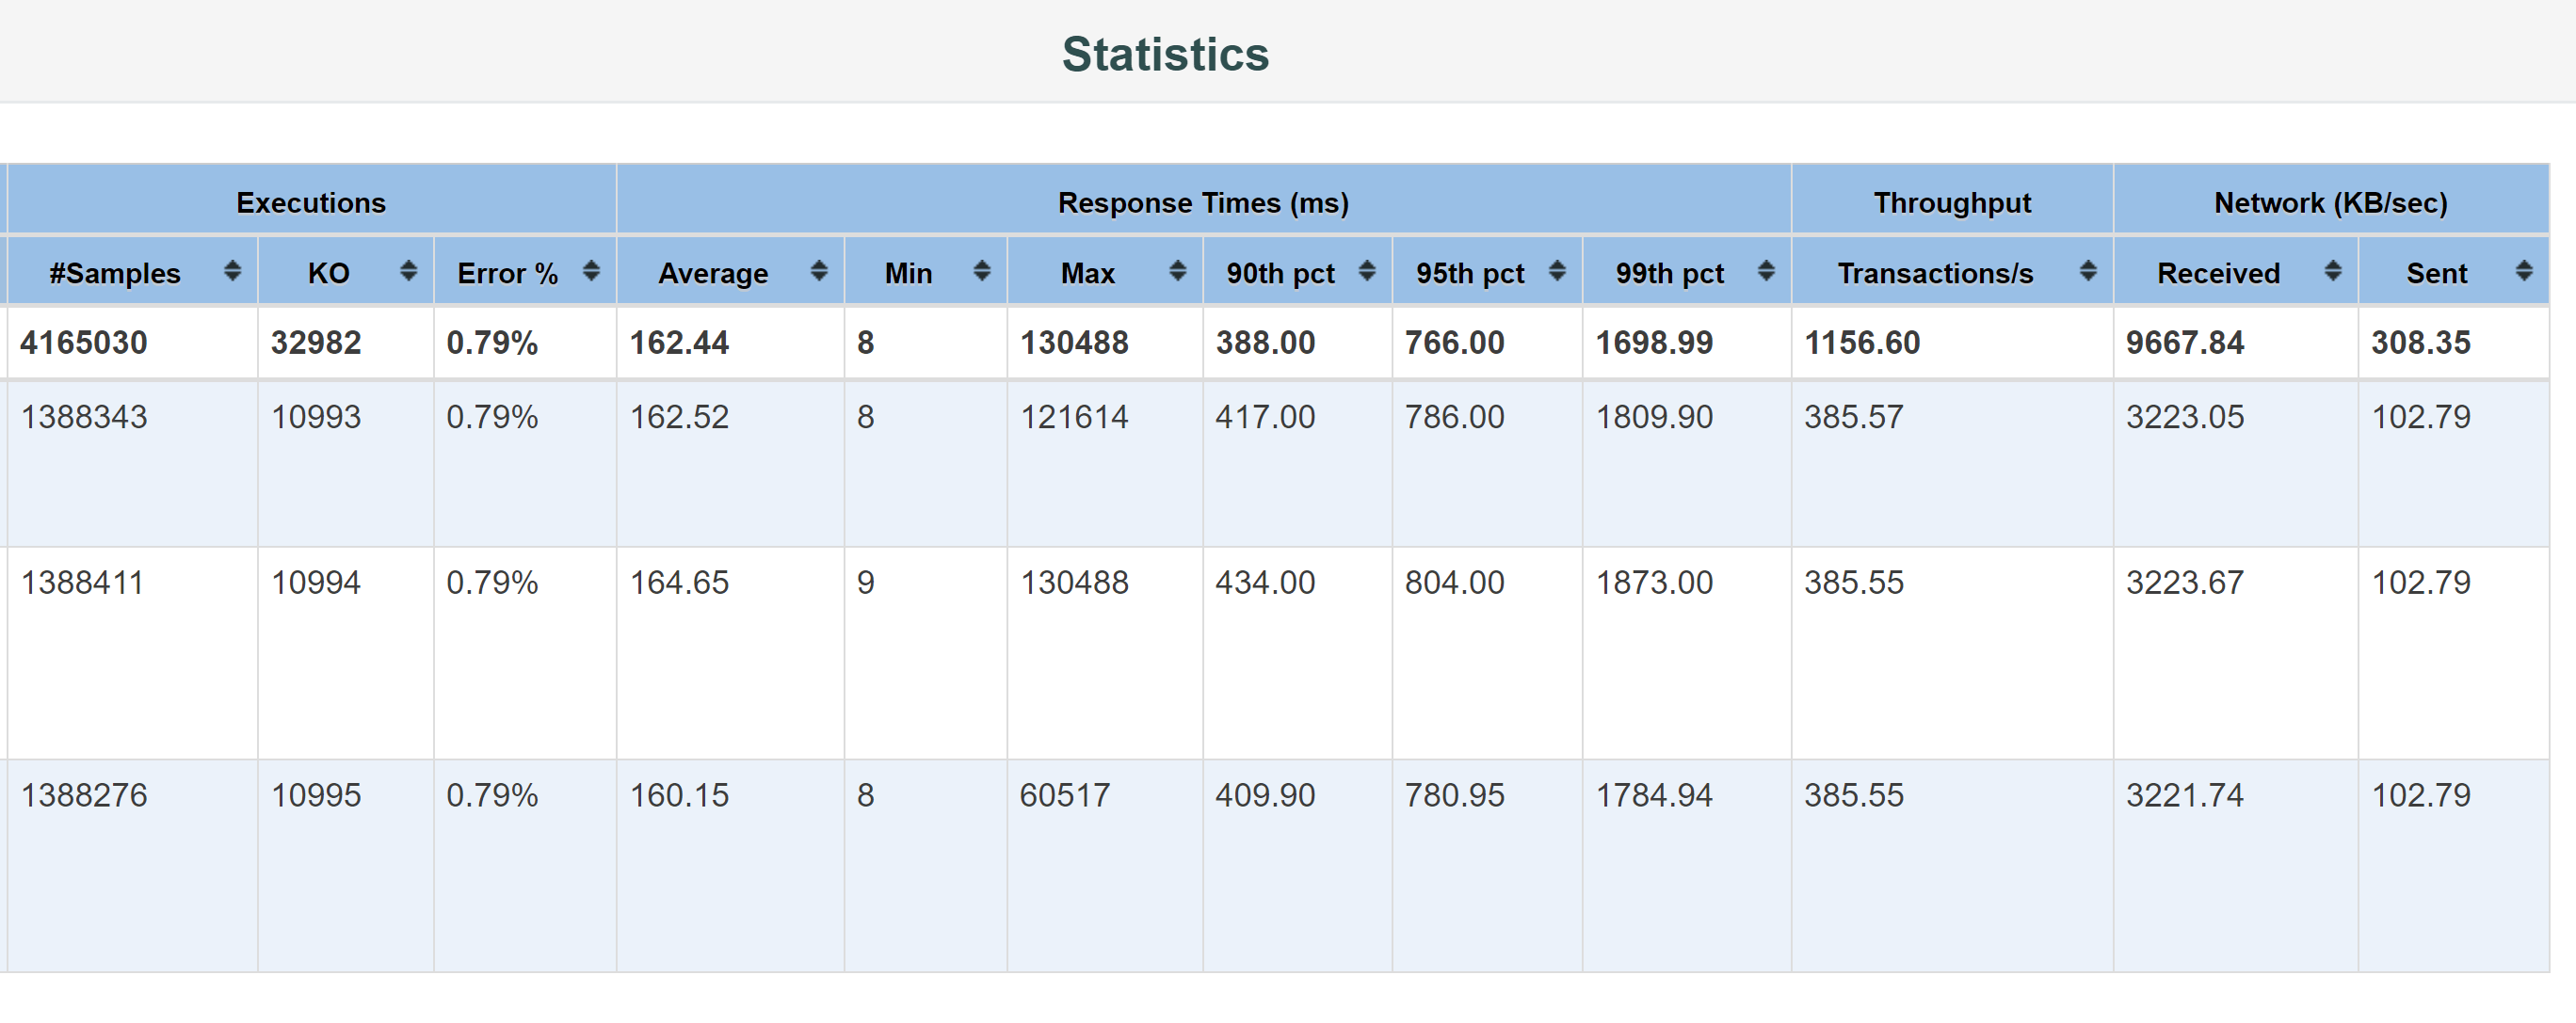
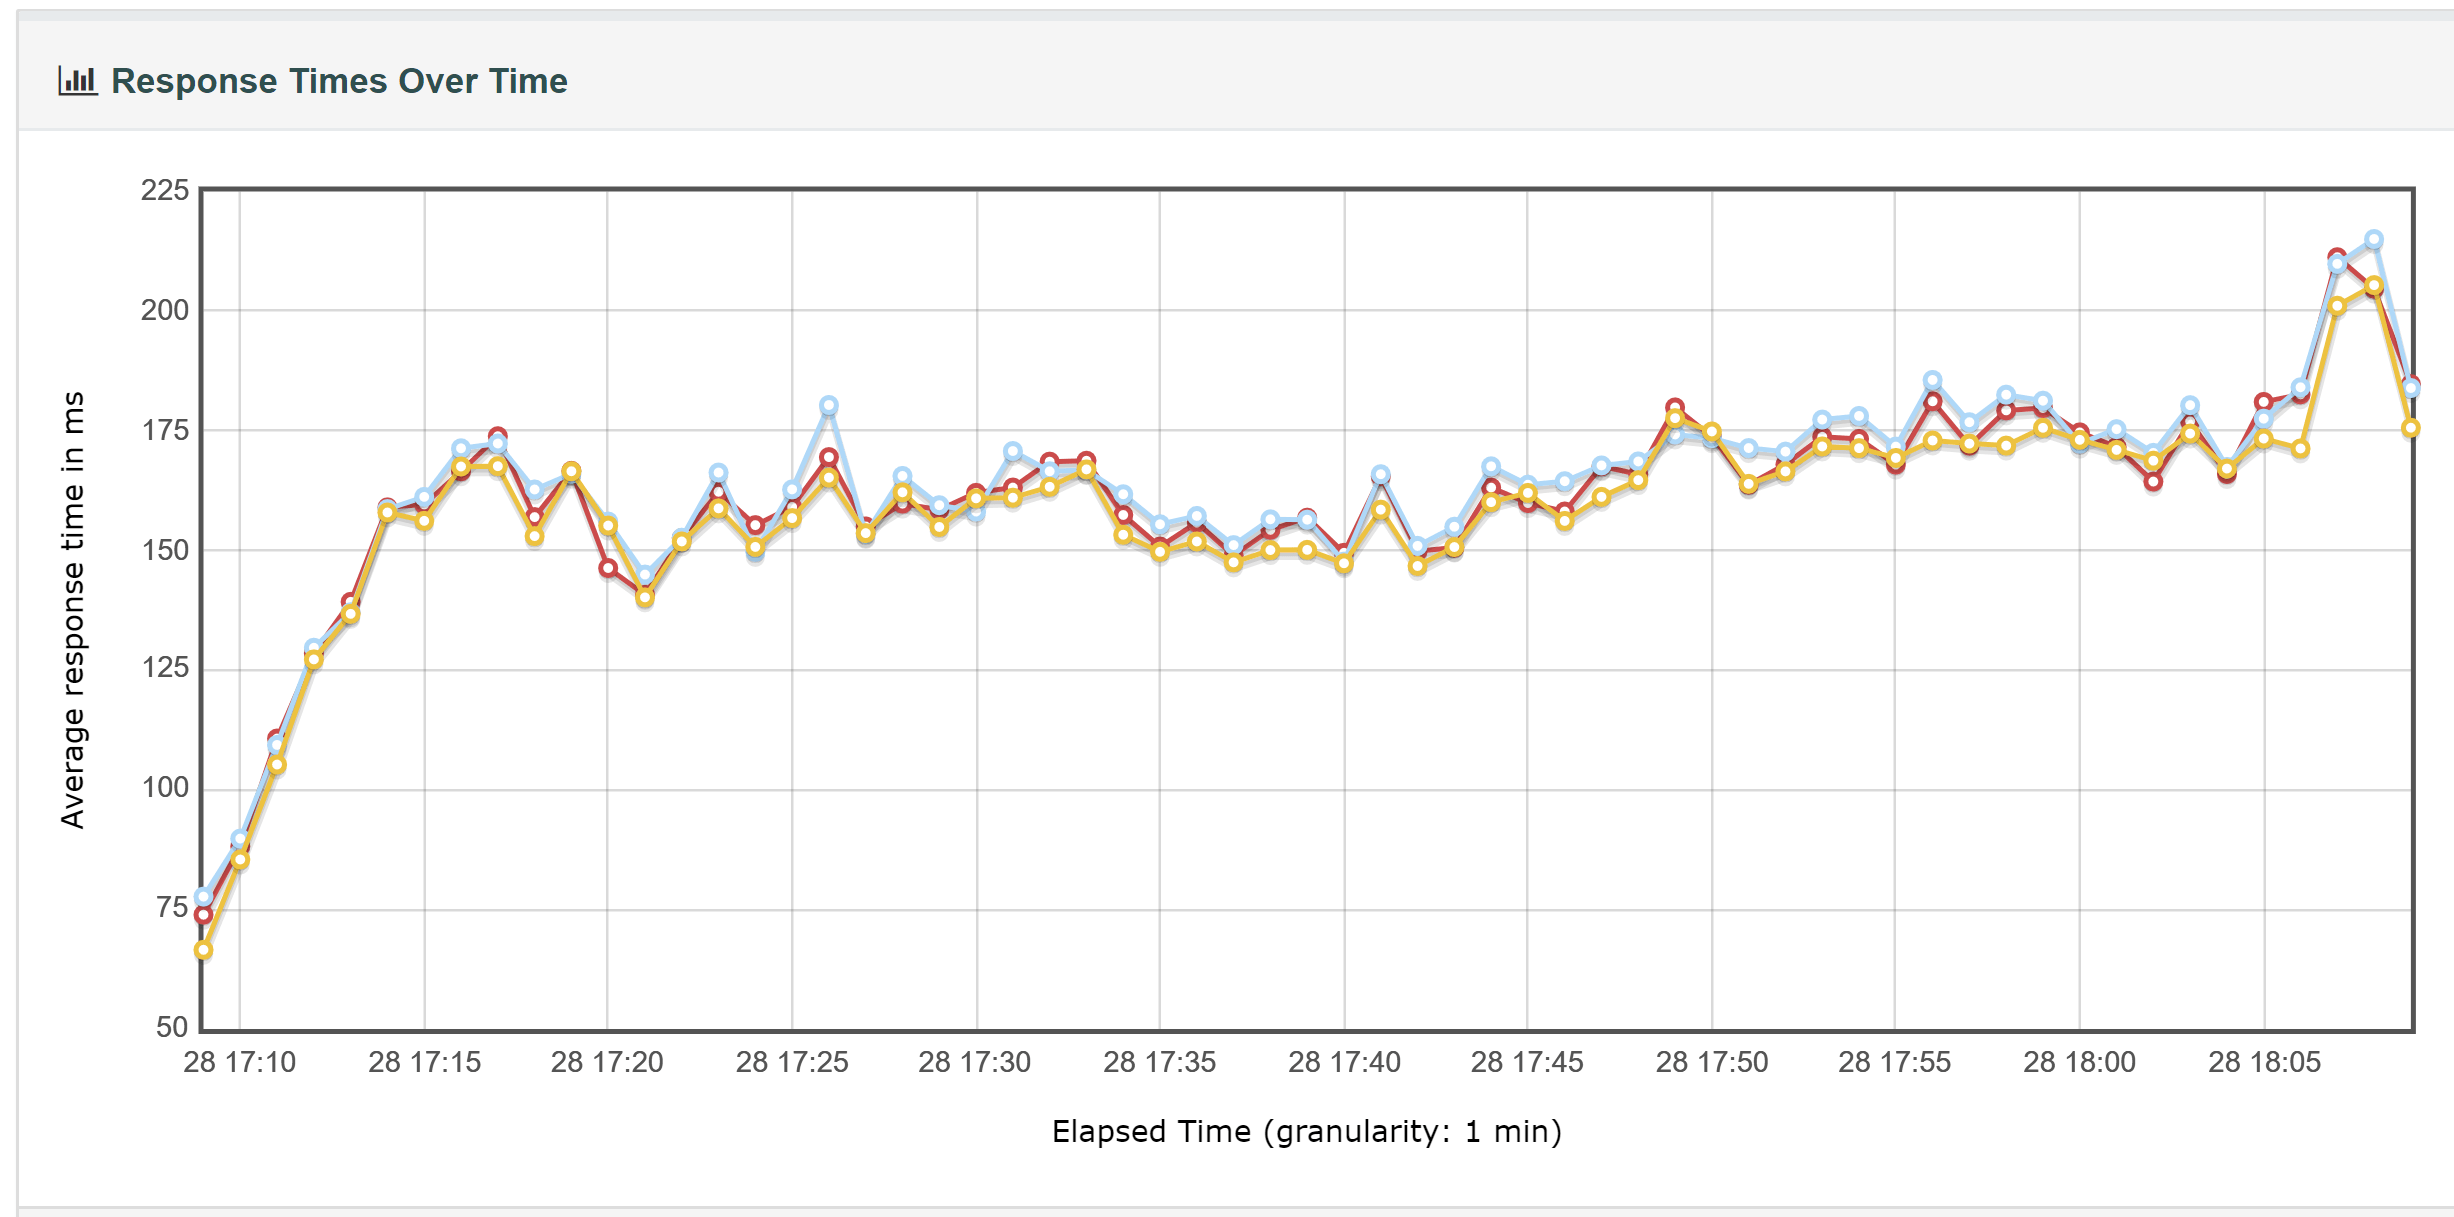
Generate Reports
Once you have your test results, you can generate the dashboard report by running below command:
./jmeter -g /home/ec2-user/result.csv -o /home/ec2-user/report
Below are some of the graphs available in the report.
References
https://jmeter.apache.org/usermanual/best-practices.html
http://www.ubik-ingenierie.com/blog/jmeter_performance_tuning_tips/